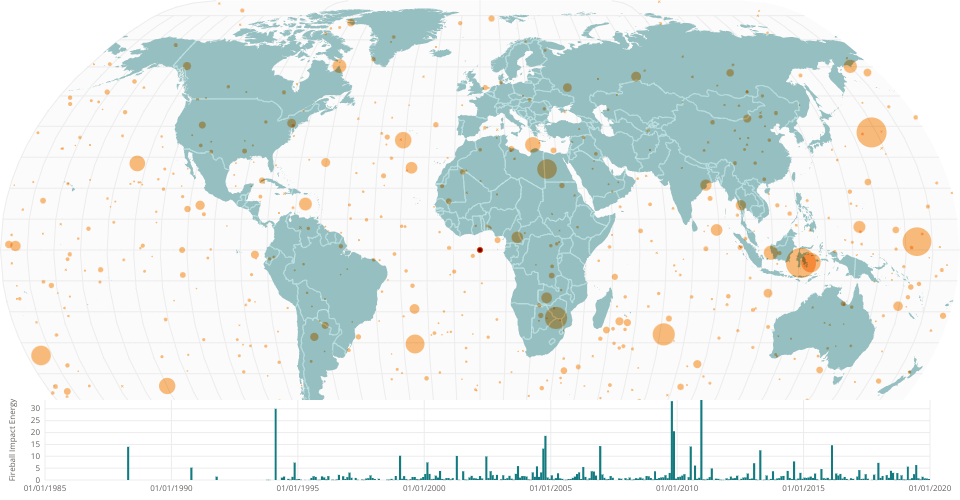
The goal of this piece was to look at the NASA data set cneos fireballs, which shows objects that have hit the earth and their location of impact, impact energy, date of impact, and several other pieces of data.
https://cneos.jpl.nasa.gov/fireballs/
I thought it would be interesting to visualize the data set by impact energy to see if there were any correlations based on date and location.
This is the second iteration of this visualization.
After completing this iteration, I found it interesting that there seem to be more major impacts in Eastern Europe and Asia, and that there seems to be an almost triangular concentration of impacts. Another interesting pattern I found was that there seems to be a spike of impacts every three to five years. It's interesting to see that most of the early recorded impacts are small and don't have location information. I'm assuming that it’s because of technological limitations.
These insights I gained from this iteration will be nice to keep in mind when revisiting the first iteration.
I also really like that doing digital visualizations allows you to iterate through several projects that would quickly eliminate a lot of trail and error for making an actual physical installation of some kind with this data set.
Country boundaries from World Atlas TopoJSON, polished for visual style, including graticules.