This visualization was constructed using the vega-lite-api. It was originally forked from one of Curran Kelleher's Vega-Lite API templates and modified to include Franchise Revenue data which originates from R for Data Science's Tidy Tuesday weekly event for July 2, 2019.
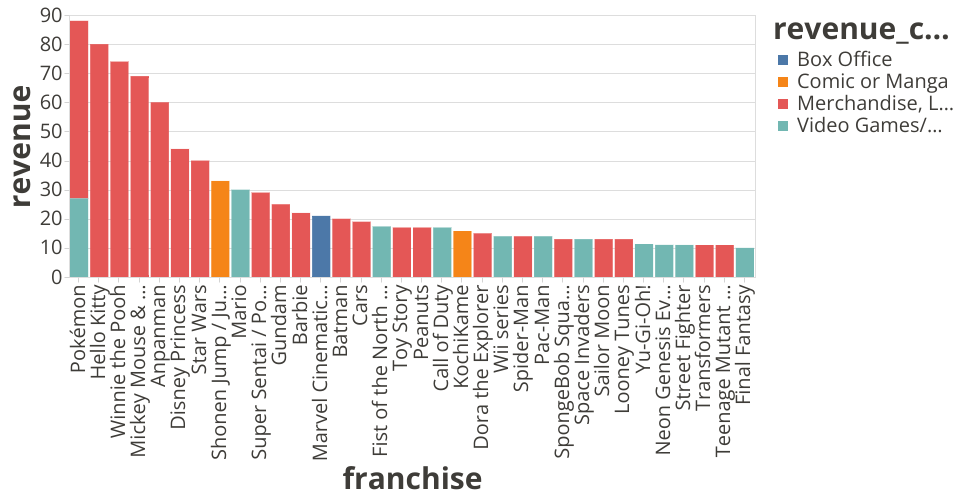
This chart shows Revenue by Franchise. I've added a filter to show only the top revenue items for readability; in future visualizations, I would prefer this was not hardcoded and rather in the hands of the user.
It's already interesting to see how merchandise dominates the field. Marvel is the only franchise to appear high in the list from movie revenue, and Shonen Jump represents the highest contribution from the manga category.
MIT Licensed