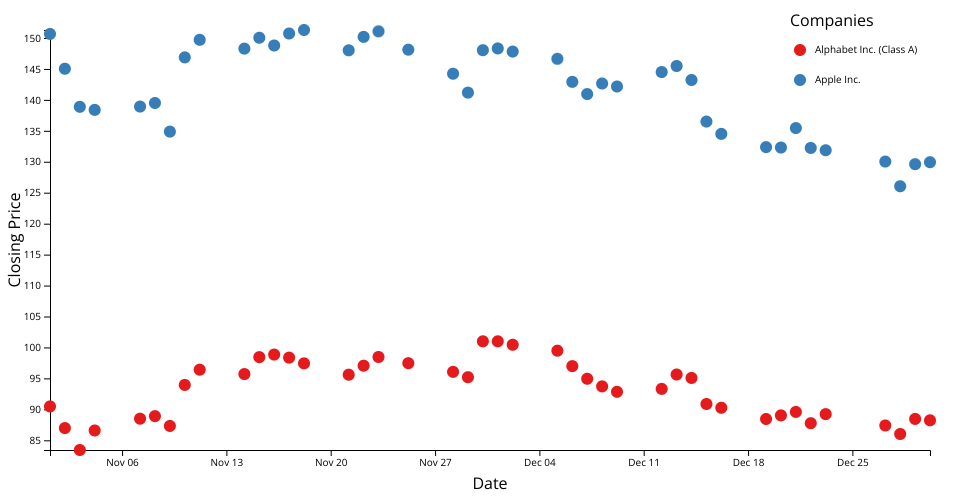
A scatter plot of 2022 Daily S&P 500 Stocks Data with Date on the X Axis and Closing Price on Y axis. A subset of stocks data consisting of Apple and Google stocks for the month of November and December were considered for the plot - https://gist.githubusercontent.com/kratikashetty/ce2fc2c3b5797665339317ce85d582b1/raw/8e538b683be93c18541a2872fe879857341660dd/sp500_stocks_2022_subset.csv
Displayed the axes using d3.scaleTime for X axis and d3.scaleLinear for Y axis. Different colors are displayed for Google and Apple stocks using d3.scaleOrdinal. In the iteration 3, introduced color legends in the plot
MIT Licensed