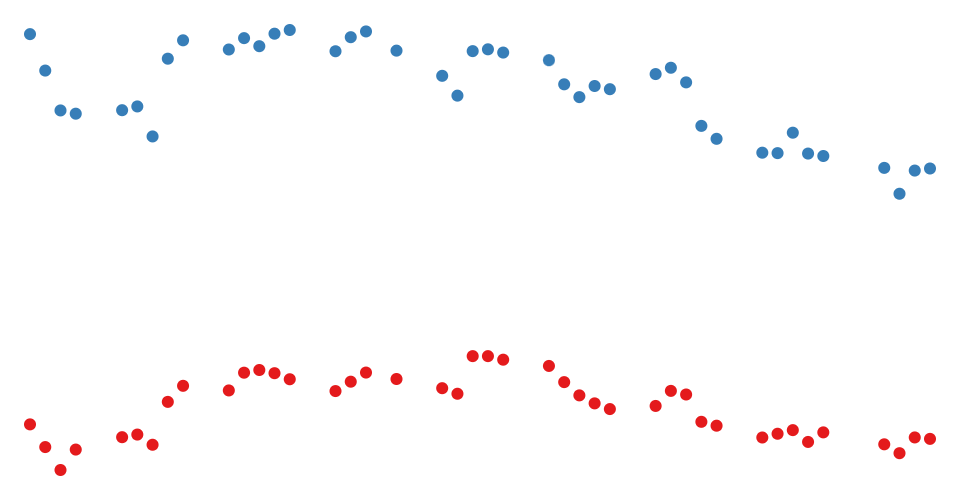
A scatter plot of 2022 Daily S&P 500 Stocks Data with Date on the X Axis and Closing Price on Y axis. Here axes are not displayed. A subset of stocks data consisiting of Apple and Google stocks for the month of November and December were considered for the plot - https://gist.githubusercontent.com/kratikashetty/ce2fc2c3b5797665339317ce85d582b1/raw/8e538b683be93c18541a2872fe879857341660dd/sp500_stocks_2022_subset.csv
Referred https://vizhub.com/surferla25/9d00028e08e84f9190bbcf8421151eef?edit=files&file=index.html to handle margins and for the color fill.
MIT Licensed