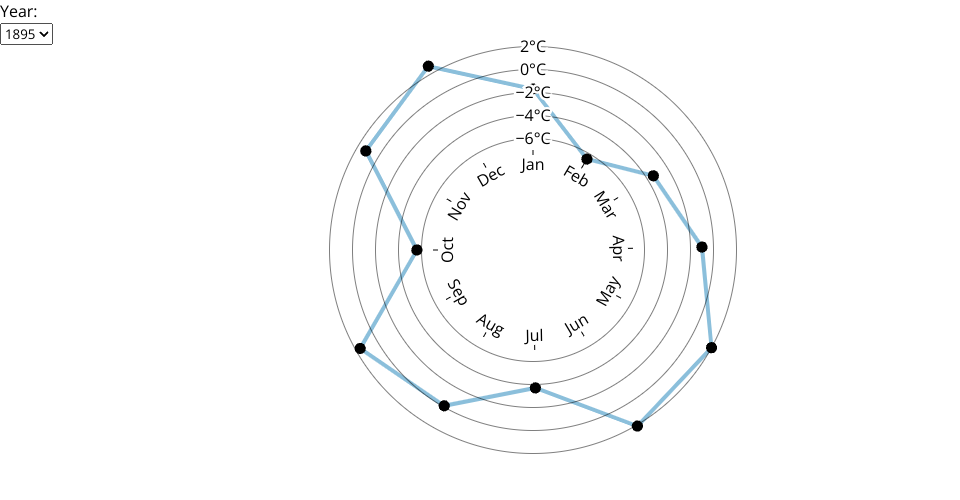
Tried to display the line across the plot from red to blue colors based on Anomaly Temperature in this iteration. But I was facing issues with this. I will be fixing this in the next update. And I will also try to plot the Anomalies across massachusetts state. I will also try to include animations in this current visualisation.
Took subset of data for the year 1895 and 1896 from - https://gist.githubusercontent.com/kratikashetty/45ef4d800b82dc4d9d486991714701cd/raw/1d63cc36842926ceec927f09e3e8a3b6a3f5c5bd/1895-2022%2520Massachusetts%2520Test.csv
MIT Licensed