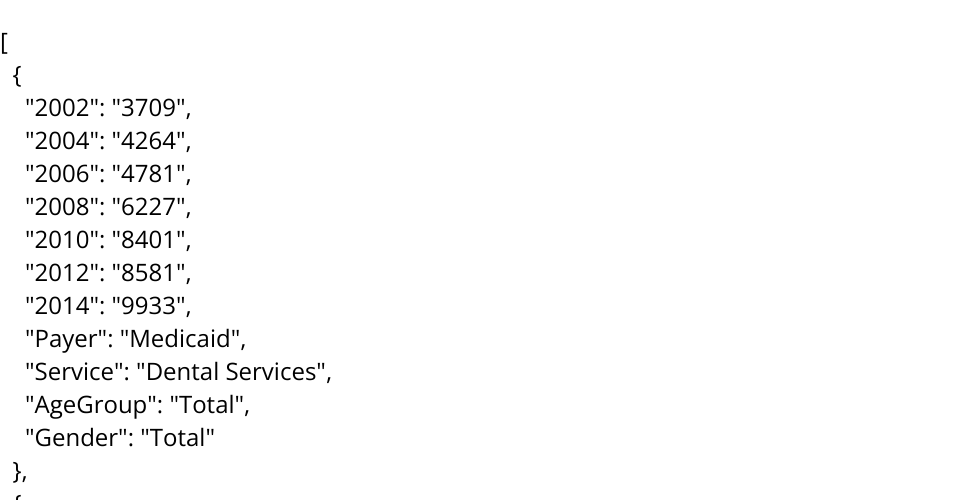
Personal health care (PHC) spending by type of good or service and by source of funding (private health insurance, Medicare, Medicaid, out-of-pocket, and all other payers and programs) is available for five age groups: 0-18, 19-44, 45-64, 65-84, and 85 and over and for males and females for selected years from 2002 through 2014.
Column name, description, type
- payer (medicaid, private health insurance, total, out-of-pocket, etc), categorical
- service( dental services, durable medical equipment, home health care, hospital care, nursing care facilities, Nursing Care Facilities and Continuing Care Retirement Communities, etc ), categorical
- age group ( 0-18, 19-64, 65 and up, total), ordinal
- gender( male, female, total), categorical
- year (2002 -2014), quantitative
Questions:
all Payers: Total Personal Health Care
- What is the difference between males and females per capita health spending in a given year?
Children (0-18)
- How does male children and female children total health care expenditure differ? Working Age Adults (19-64):
- Is there any difference between working-age (19-64) males and females per capita spending.
Older Adults (65 and older)
- What percentage of health care sepnding accounted for females 65 and older and what percentage of 65 and older population are females.
links:
MIT Licensed