The data comes from Alberto Cairo courtesy of Steph Locke + Lucy McGowan.
Taken from the #TidyTuesday github repo here.
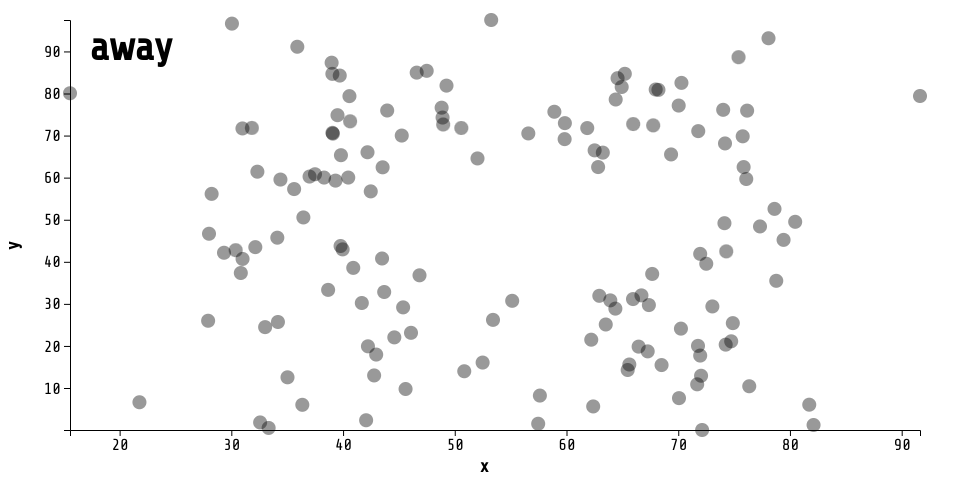
This represents 12 different datasets with almost identical summary statistics but wildly different underlying distributions.
Moral of the story: Always plot your data!
Question: Can I make the plot title first go up and then come down? line 123 of scatterPlot.js
MIT Licensed