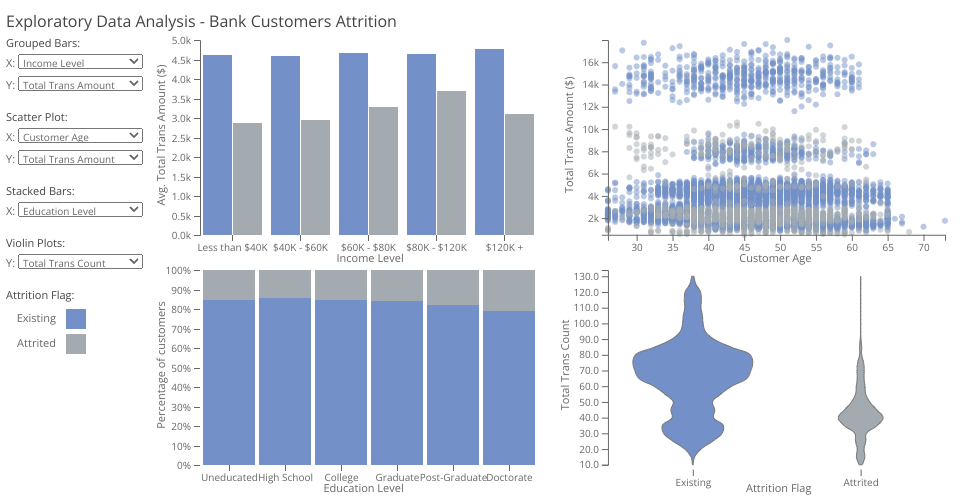
A dashboard using D3 displaying data of credit card utilization from the Bank Customers Dataset.
It consists of 4 dynamic plots. A grouped bar chart, scatter plot, stacked bar chart and violin plots. The attrition status of the bank customers is encoded on the color of the elements.
Finally, there are some menus available for each plot to enable the users to choose which columns to be presented.
MIT Licensed