datraviz 2018 #10 - scatter plot, csv file
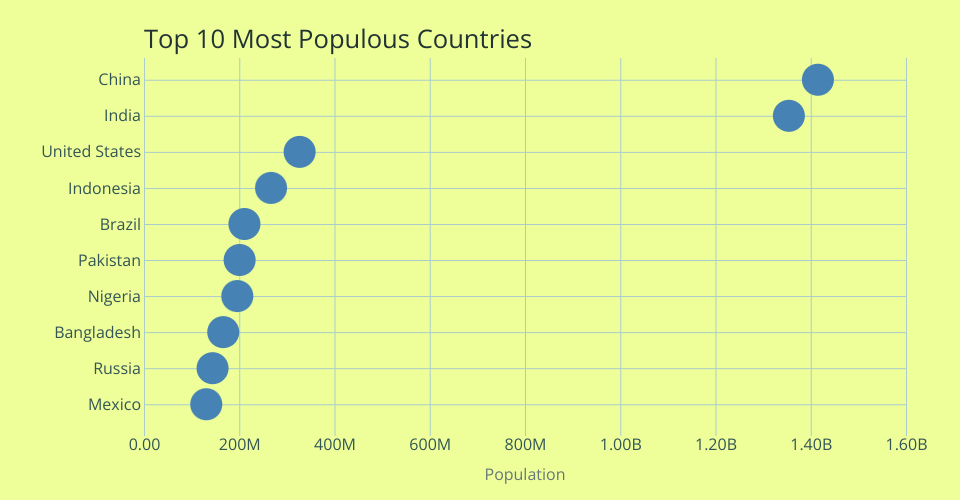
-- This "scatter plot" chart shows population of the top 10 most populous countries. The data comes from the year 2018 estimate in United Nations: World Population Prospects 2017. It also demonstrates customization of D3 axes.
MIT Licensed