Interactive Donut Chart with Category Menu with D3
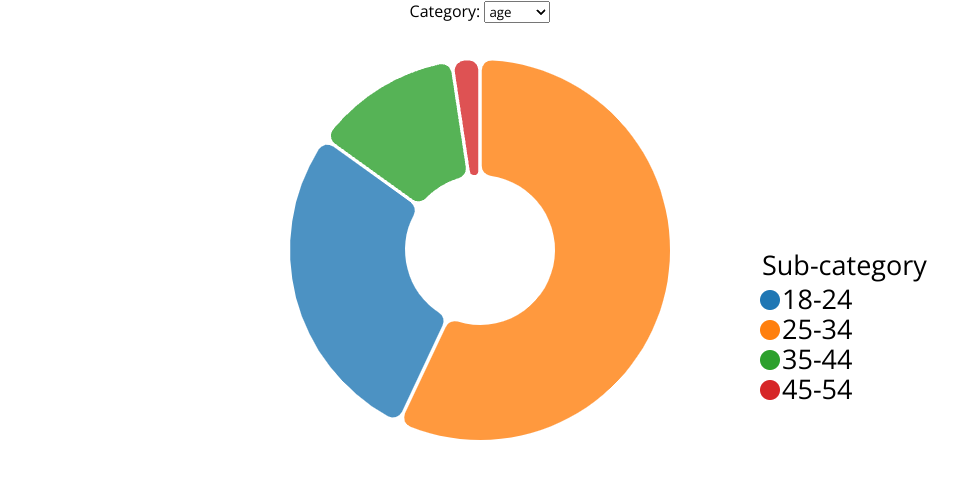
This visualization shows the number of players for each demographic category (age and gender). Each slice along with associated color represents a subcategory of the age and gender class. The dropdown at the top allows filtering factories based on the selection of category. Users can are given the default view of the age class or and can select the other category 'gender' through the dropdown menu. Hovering over slices of donut chart shows labels, percent, and the total number of users.
MIT Licensed