The world map shows country boundaries from World Atlas TopoJSON, polished for visual style, including graticules.
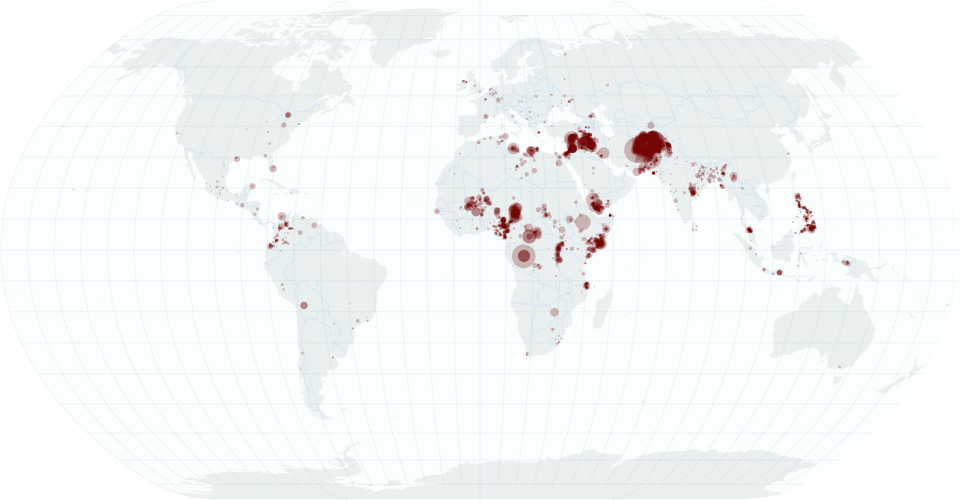
The points on the map shows 2018 global terrorism events.
The size of the points represents the number of people who were wounded or killed in the terrorism event.
I try to adjust the points color to bloody red to make the points look like blood. And multiple views are to be added in the viz.
MIT Licensed