Car Ratings Visualization
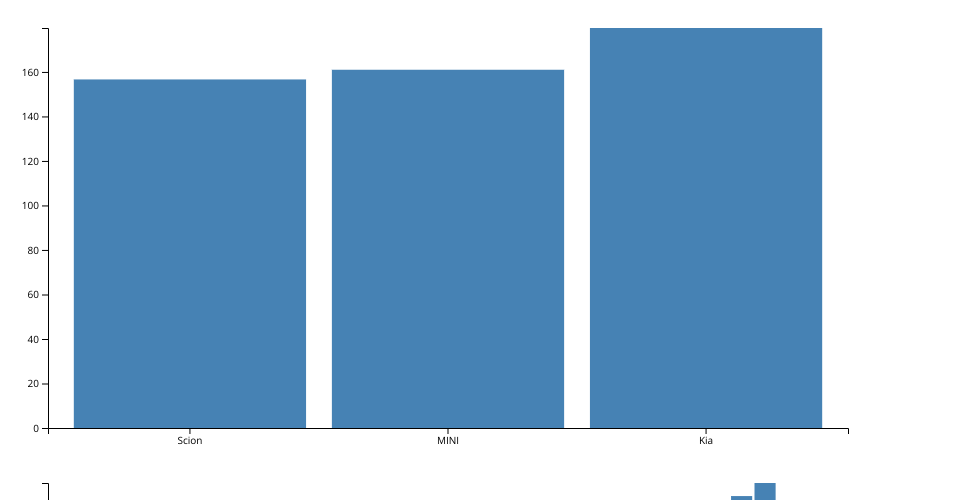
This project visualizes car ratings according to genres using D3.js. It takes input data from a CSV file containing information about car ratings in terms of horsepower, torque, and highway mpg for various car brands.
Table of Contents
Introduction
This visualization project aims to provide insights into the performance ratings of different car brands across various genres, focusing on horsepower, torque, and highway mpg. The visualization is presented as a stacked bar chart, with each bar representing a car brand and segments within the bar representing the ratings for each genre.
Usage
To use this visualization:
- Clone the repository to your local machine.
- Ensure you have a modern web browser installed.
- Open the
index.htmlfile in your web browser.
The visualization will load and display the car ratings according to genres. You can hover over each segment of the stacked bars to view detailed information about the ratings.
Data
The input data for this visualization is provided in a CSV file named data.csv. The CSV file contains the following columns:
genre: The genre of the car brand.horsepower: The horsepower rating of the car brand.torque: The torque rating of the car brand.highway_mpg: The highway mpg rating of the car brand.