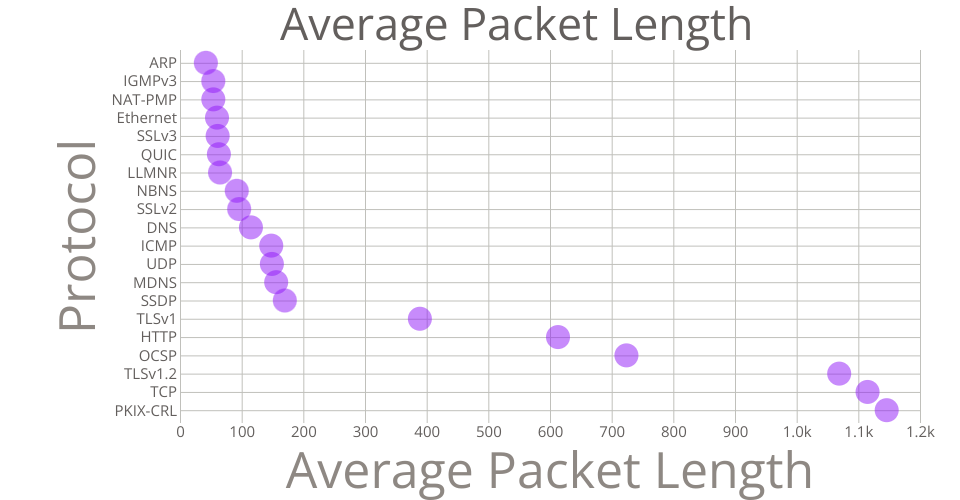
This scatter plot shows data about packet headers. The y-Axis shows protocol names sorted by the average length of their corresponding packets. The x-axis show the average packet length in number of bytes.
This data was generated in 2016 by Stratosphere labs network traffic captures. This particular dataset comes with other network traffic log sources as well as a description of the actions taken to produce the traffic.
The data in this scatter plot was modified from the original dataset. The columns were grouped by "Protocol" and then the length field was aggregated to obtain the average value per protocol.
The tool-tip code was taken from user "d3noob" on bl.ocks.org
MIT Licensed