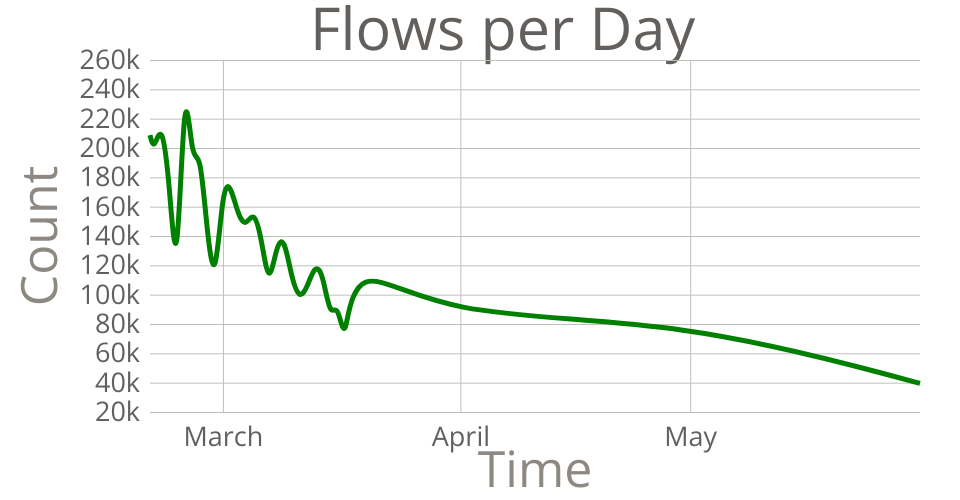
This line chart shows the number of flows per day occuring over a three and a half month period.
This data is netflow data with correlated keyboard, mouse, and gui activity fields. This is a novel data source representing windows on a desktop (user interactions)
This data comes from a private data source provided by a professor at WPI. This professor has cleared this data set for public use.
MIT Licensed