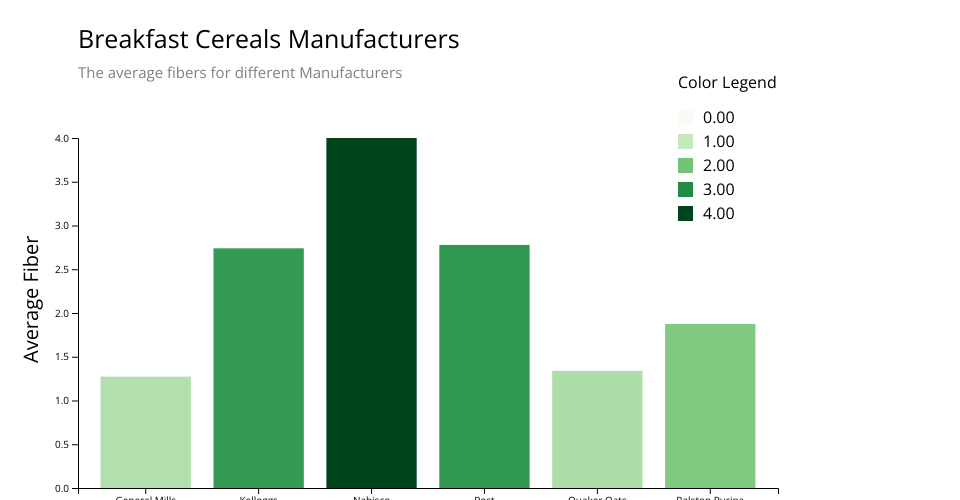
Cereal dataset from 'https://domo-support.domo.com/s/article/360043931814?language=en_US' The dataset provides nutritional data on 80 different breakfast cereals, and cleaning to be only 2 columns: manufacturer and avg_fiber.
The bar graph displays and compares the average fiber across 6 different cereal manufacturers.
The color and legend reference to 'https://d3-legend.susielu.com/'.
MIT Licensed