A program that loads and parses some CSV data from the Fatal Police Shootings Database compiled by the Washington Post
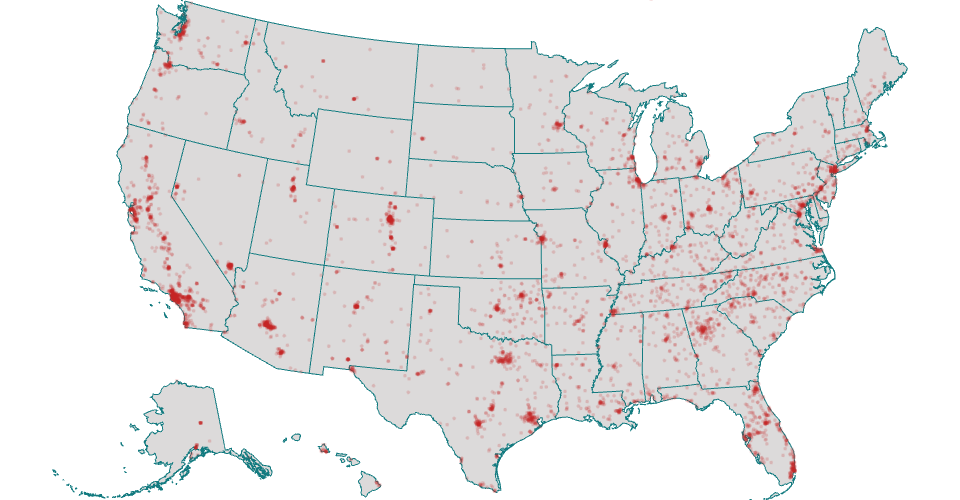
I used the U.S. Geo Map of State Boundaries for the underlying map. In this iteration, I used the geoAlbersUsa projection to clean up and zoom in on the map. While other projection types appear to gracefully handle a lat/long input of 0, it returns null with this projection, which causes a fatal error when you reference the scaled pixel locations.
Adapted from Mass School District Boundaries from the DataVis class.
The intent is to map each event to it's location within the U.S. with a semitransparent circle to show darker regions as the areas with higher event density. This helps to answer the question "are there more fatal police shootings in certain parts of the country?" There are clearly areas with more events, though at a glance they appear to be in population centers.
What you can't see yet is that I've also improved the useData.js file to clean null data from fields I'll be using in future work. Blank data entries are now populated with "unknown" for the gender, race, flee, and armed fields. The age field is populated with a -1 for any blank entries. I've also placed a data aggregation prototype in the index.js file using the nest() and rollup() functions to create a new data array where each element contains a state key and a count. I hope to be able to utilize this framework with a menu to allow the user to select a grouping field to interact dynamically.
To do:
- <input checked="" disabled="" type="checkbox"> Improve zoom level for better visibility
- <input checked="" disabled="" type="checkbox"> clean nulls in data (changed blanks to "unknown")
- <input checked="" disabled="" type="checkbox"> aggregate data per state
- <input disabled="" type="checkbox"> develop a module to build a pie chart
- <input disabled="" type="checkbox"> develop a module to plot pie charts in the center of each state
- <input disabled="" type="checkbox"> use the path.centroid() function to plot aggregated data