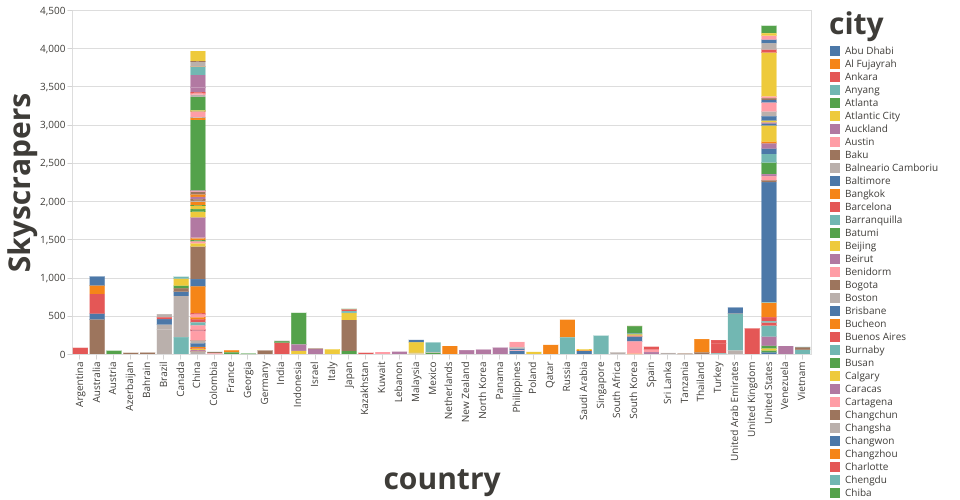
The full data I propose to visualize for my project is about the number of completed highest structures in the world cities. Building greater than 100 meters was counted on the world map.
- You can find the original data for Cities Ranked by Number of Completed Buildings on the skyscraper center
The attribute
1- Rank
2- City
3- Country
4- AllBuilding: Number of building in the city
5- 100m: Building has 100m+
6- 150m: Building has 150m+
7- 200m: Building has 200m+
8- 300m: Building has 300m+
9- TelecomTowers: Radio masts and towers are typically tall structures designed to support antennas for telecommunications and broadcasting
10- AllStructures: All structures
11- lat: Latitude
12- lng: Longitude
13- first150m: the year of the first building higher than 150m+
MIT Licensed