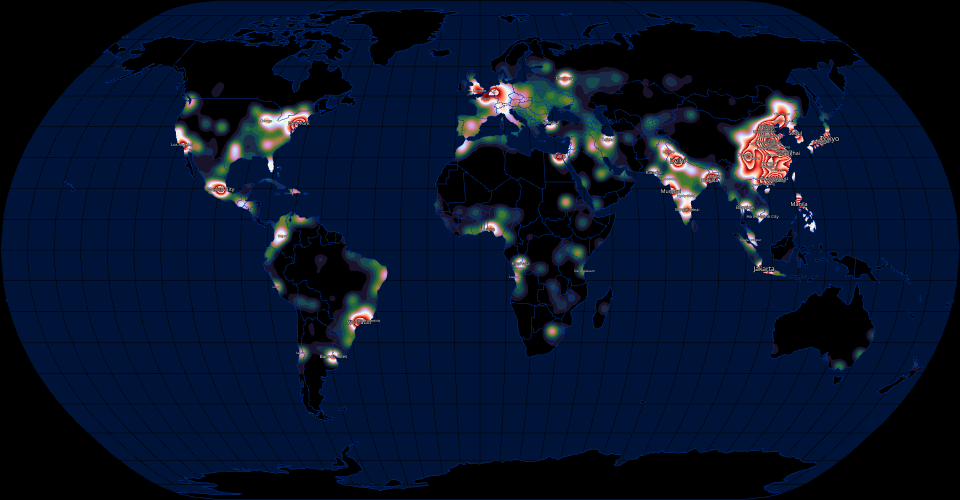
A world map showing estimated population density contours. Computed from Simplemaps: World Cities Database, weighted using city populations. Contours and density estimation computed by d3-contour. Has zooming too!
The colors are computed by interpolating between the CubeHelix and Reds color scales. The interpolation is based on the estimated population density where the CubeHelix color scale is used at the first level of density, and as the density increases the colors loop around the red spectrum, using the Reds color scale. This technique is used to visually represent varying levels of density on the map.
Challenges
- Create a color legend
- Make this work with globe-based panning and zooming
MIT Licensed