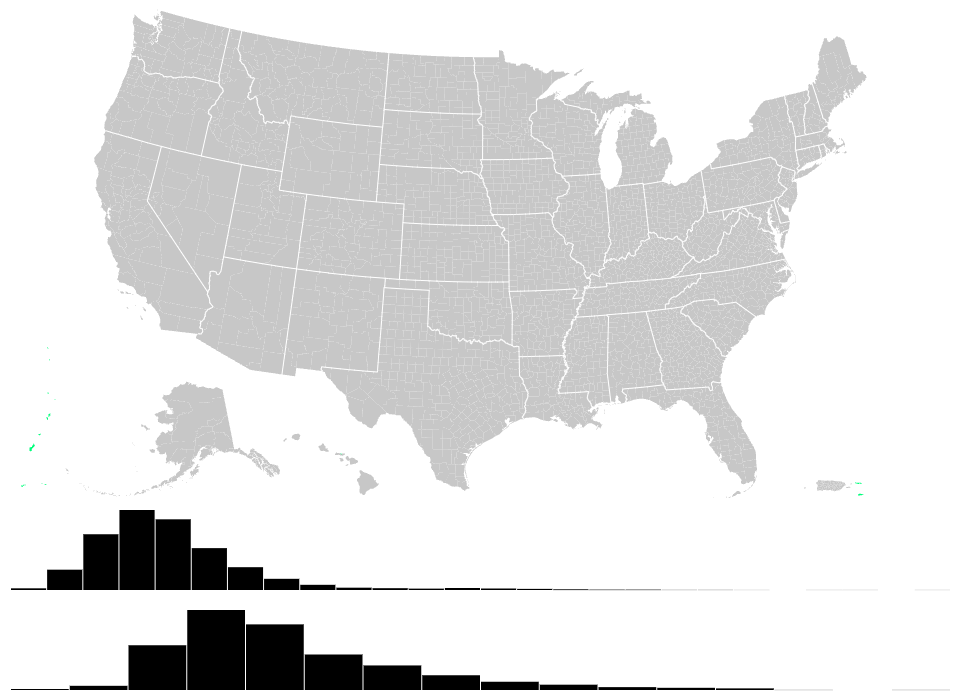
A rough PoC for multiple histograms linked to a choropleth map where color represents the number of matching filters. Shows two metrics:
- Unemployment rate by U.S. county, August 2016 from the BLS.
- Educational attainment ("Percent of adults with a bachelor's degree or higher, 2018-22") from USDA Educational Attainment Dataset
MIT Licensed