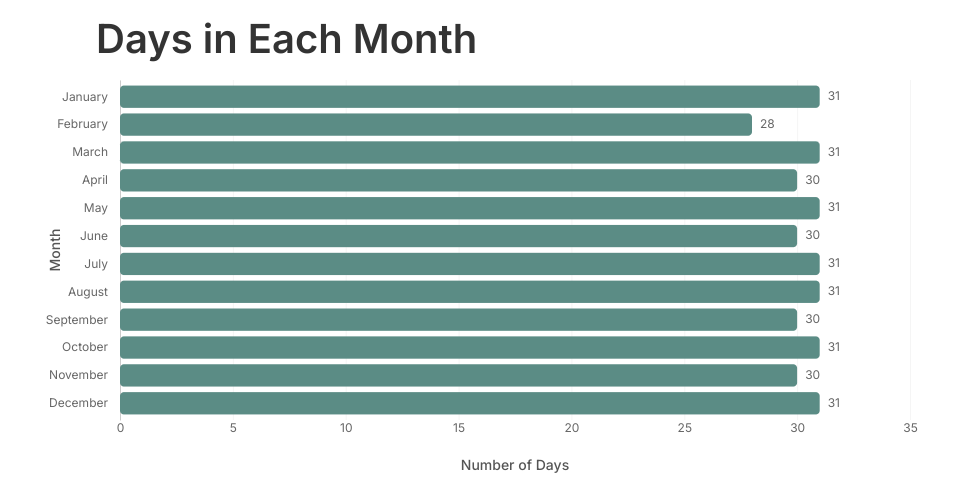
Days in Each Month Bar Chart
A responsive horizontal bar chart visualization built with React and D3.js that displays the number of days in each month of the year.
Features
- Interactive Design: Click on bars to highlight individual months
- Responsive Layout: Automatically adapts to container size changes
- Smooth Animations: Hover effects and selection transitions
- Clean Typography: Uses Inter font family for modern appearance
- Accessible Styling: Clear axis labels and gridlines for better readability
Data
The chart visualizes a simple dataset (data.csv) containing:
- Month names: January through December
- Days count: Number of days in each month (28-31)
Technology Stack
- React 19: For component lifecycle and state management
- D3.js v7: For data visualization, scales, and axis rendering
- Modern JavaScript: ES6+ modules with import maps
- CSS3: Custom styling with hover effects and transitions
File Structure
MIT Licensed
Comments
That's cool