D3 Stacked Bar Chart Example
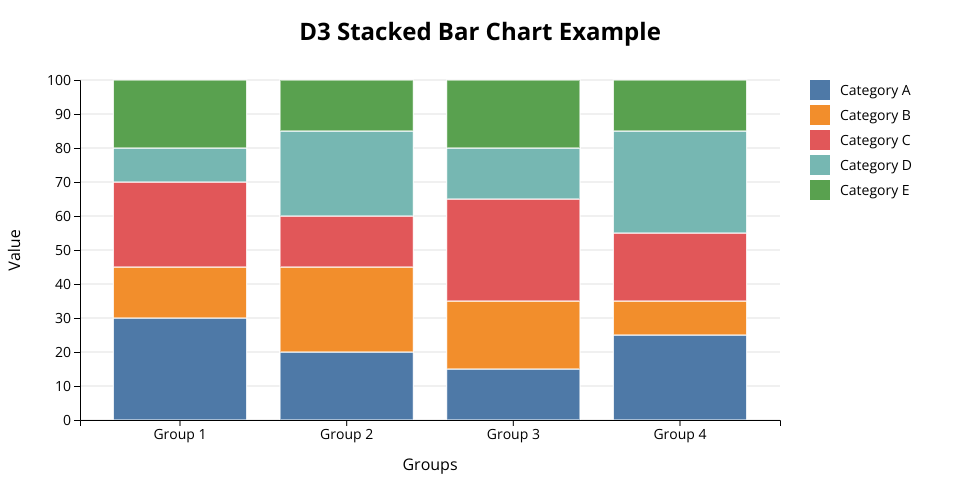
This is a simple example that demonstrates how to create a stacked bar chart using D3.js. The visualization includes:
- A stacked bar chart with 4 groups and 5 categories
- Grid lines that appear behind the bars
- Axes showing groups and values
- A legend showing each category
- A title
The SVG is set to fill the entire page, and each segment has a different color with a white stroke for better visibility.
Features
- Responsive layout that fills the browser window
- Color-coded stacked segments
- Grid lines positioned behind the bars
- X and Y axis labels
- Legend showing category names
Running the Example
- Install dependencies:
npm install - Build the project:
npm run build - Open index.html in your browser
MIT Licensed