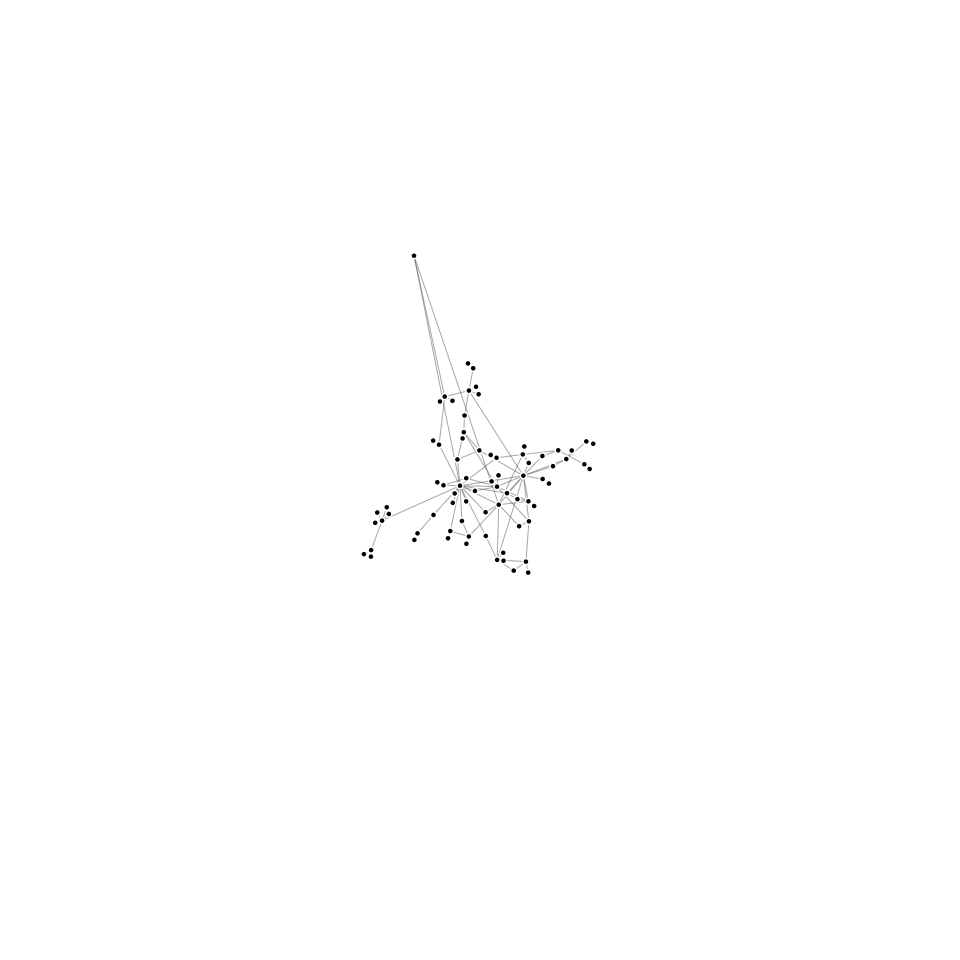
Barabási–Albert Network Model Visualization
This visualization demonstrates the Barabási–Albert model for generating scale-free networks using preferential attachment. The algorithm adds a new node to the network every 500ms, connecting it to e
Based on an old implementation.
How it works
- The simulation starts with two connected nodes
- Every 500ms, a new node is added to the network
- The new node connects to existing nodes with probability proportional to their degree (preferential attachment)
- This creates a scale-free network where some nodes become highly connected "hubs"
Features
- Interactive force-directed graph visualization using D3.js
- Nodes can be dragged to explore the network topology
- Auto-scaling as the network grows
- Real-time visualization of the preferential attachment process
- New nodes are positioned randomly within the visual space
This is an implementation of the Barabási–Albert model described at: http://en.wikipedia.org/wiki/BA_model
MIT Licensed