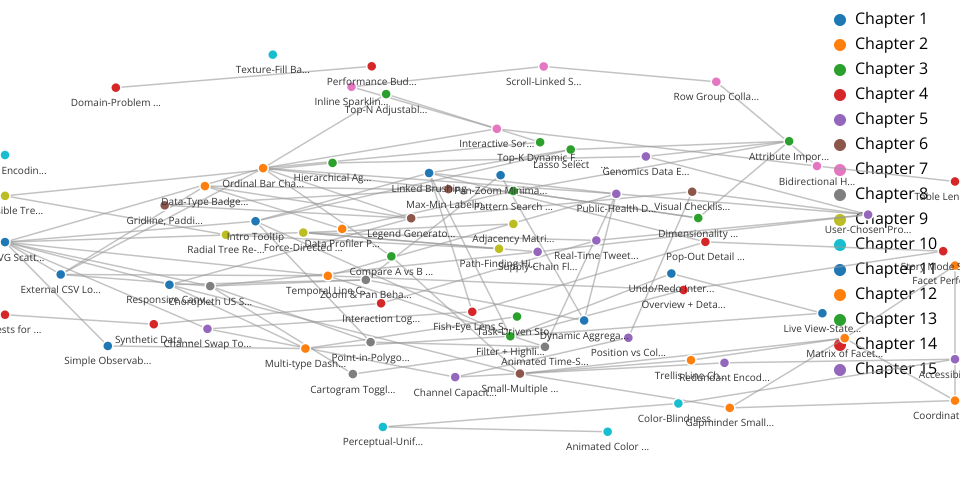
D3 Force-Directed Graph
This project implements a force-directed graph visualization using D3.js.
Features
- Interactive force-directed graph visualization
- Node coloring by chapter
- Tooltips showing node details
- Drag and zoom capabilities
- Responsive design that adapts to window size
- Legend for chapter color mapping
- Custom directional force that arranges nodes based on dependency relationships
Data Structure
The visualization uses two key data files:
nodes.json: Contains information about each node, including id, label, description, and chapteredges.json: Contains the connections between nodes with source and target properties
Layout Logic
The graph implements a custom directional force where:
- Nodes are pushed in specific directions based on their dependencies
- Source nodes (no dependencies, many dependents) are pushed to the left
- Sink nodes (many dependencies, no dependents) are pushed to the right
- The position of each node is determined by analyzing its connectivity pattern
Configuration
All constants and visual parameters are defined in the config.js file, making it easy to adjust the appearance and behavior of the graph without changing the core logic.
Usage
Simply open the index.html file in a browser to view the visualization. You can:
- Hover over nodes to see detailed information
- Drag nodes to reposition them
- Zoom in/out using the mouse wheel
- Pan by clicking and dragging the background
MIT Licensed