Aider LLM Performance Visualization
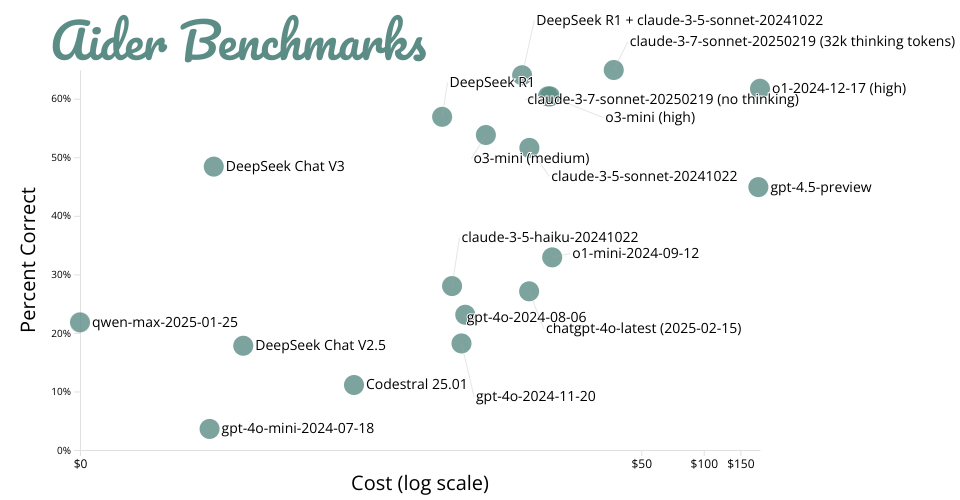
This visualization shows benchmark results from Aider's LLM leaderboards, comparing different Large Language Models' performance at code editing tasks against their cost per run.
What the Chart Shows
The scatter plot visualizes two key metrics:
- Percent Correct (Y-axis): The percentage of coding exercises successfully completed by each model, ranging from 0-100%
- Cost (X-axis): The cost in USD to run the full benchmark suite, shown on a logarithmic scale
Each point represents a different LLM, with models like Claude-3-Sonnet, GPT-4, and various open source models compared. Some key observations:
- Claude-3-Sonnet (with 32k thinking tokens) leads with ~65% accuracy at $36.83
- DeepSeek models offer good performance at lower costs
- Some newer models like Gemini and Yi-Lightning show promise but have variable performance
- Costs range dramatically from under $1 to over $180
The interactive visualization allows you to:
- Hover over points to highlight specific models
- Click points to focus on individual models
- See connecting lines to labels when they need to shift for readability
Technical Details
Built with React and D3.js, this visualization automatically scales to fit the browser window and uses force-directed label placement to prevent overlapping text labels.
The cost axis uses a symlog (symmetric log) scale to better display the wide range of costs while handling values near zero. The percentage axis uses a linear scale from 0-100%.