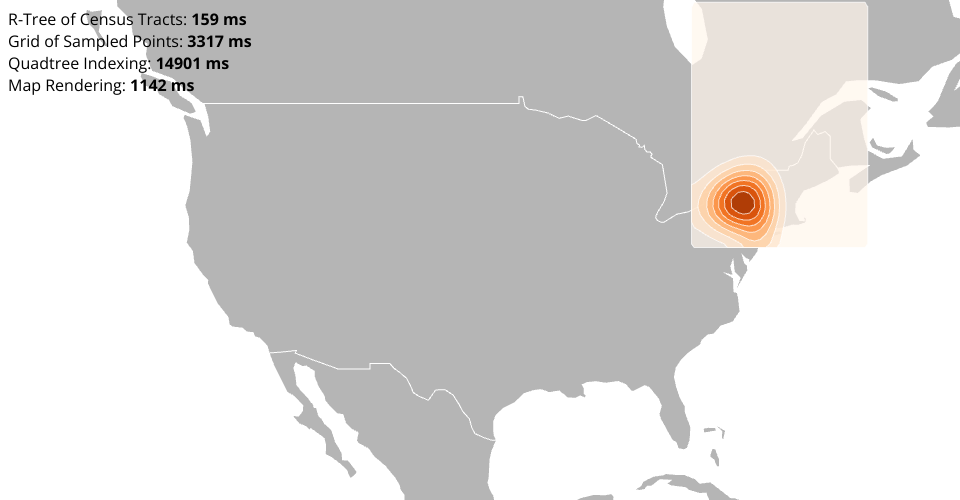
Proof of concept for a technique for visualizing Census Tract level data on a map using contours. The goal of this technique is to provide a performant map where you can pan and zooom, approximating a choropleth map. The problem with rendering all census tracts as a choropleth map is that there are just too many, and even WebGL struggles to render so many geometries.
Elements of this technique:
- Index census tracts in an R-tree
- Sample census tract data values over a uniform grid (which corresponds to the leaf nodes of a quadtree) using the R-Tree
- Index the uniform grid in a Quadtree
- Aggregate data values up the quadtree using averaging
- Query the quadtree based on the map viewport and a size threshold
- Adjust the color scale based on the extend of those values
- Render the values as colored rectangles using Canvas
The idea is that this is a precursor to computing a dynamic contour map.
Limitations of this Technique
- We reach a resolution limit on the grid. Anything beyond 11 levels of quadtree subdivision takes more than 5 seconds to compute.
Future directions
- Sample data based on rectangles - Since we are sampling data from census tracts, the most accurate way to do this would be to consider all census tracts that intersect or are contained within a grid rectangle, compute the geometry of their intersection with the grid rectangle, and then compute a weighted average of their data values using the area of the intersecting geometries as the weight.
- Sample Dynamically - Ideally when you zoom in beyond the precomputed level of detail, an additional level of detail would be computed, but just for the visible area. This could be done by keeping track of when we request to view nonexistent quadtree nodes, and for each of those we compute a new sample from the census tracts data, and add those as new entries to the quadtree. This one improvement would make this technique dramatically more scalable - to the entire US at all zoom levels, including zoomed into dense urban areas (which currently are out of reach due to the resolution limitation of the grid).
MIT Licensed