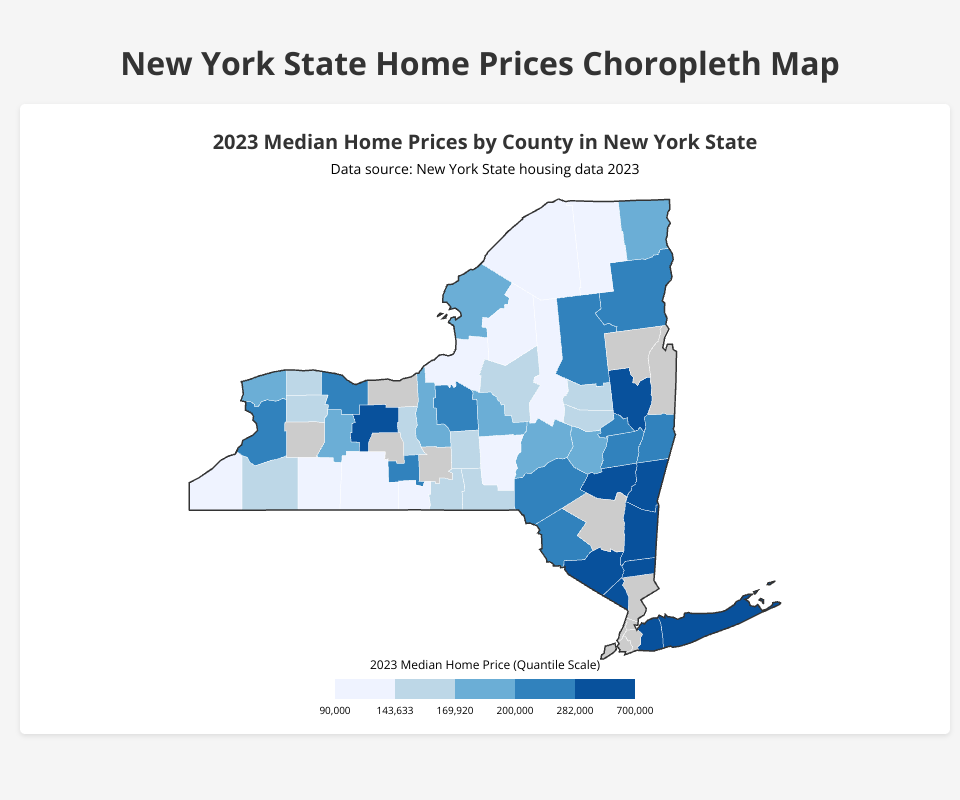
New York State Home Prices Choropleth Map
This visualization displays the median home prices across counties in New York State for 2023. The map uses a quantile scale with 5 color classes to show the distribution of home prices.
Features
- Choropleth map of New York State counties
- Quantile color scale showing median home prices
- Tooltip information on hover
- Legend with quantile thresholds
Data Source
The visualization uses 2023 housing data from New York State, including median home prices and number of sales by county.
File Structure
index.html- Main HTML filestyles/main.css- CSS stylesdata/data.csv- County housing datajs/- JavaScript modules:main.js- Entry point that initializes the applicationdataLoader.js- Functions to load and process datamapCreator.js- Functions to create and render the mapcolorScale.js- Functions to create color scaleslegendCreator.js- Functions to create the map legend
MIT Licensed