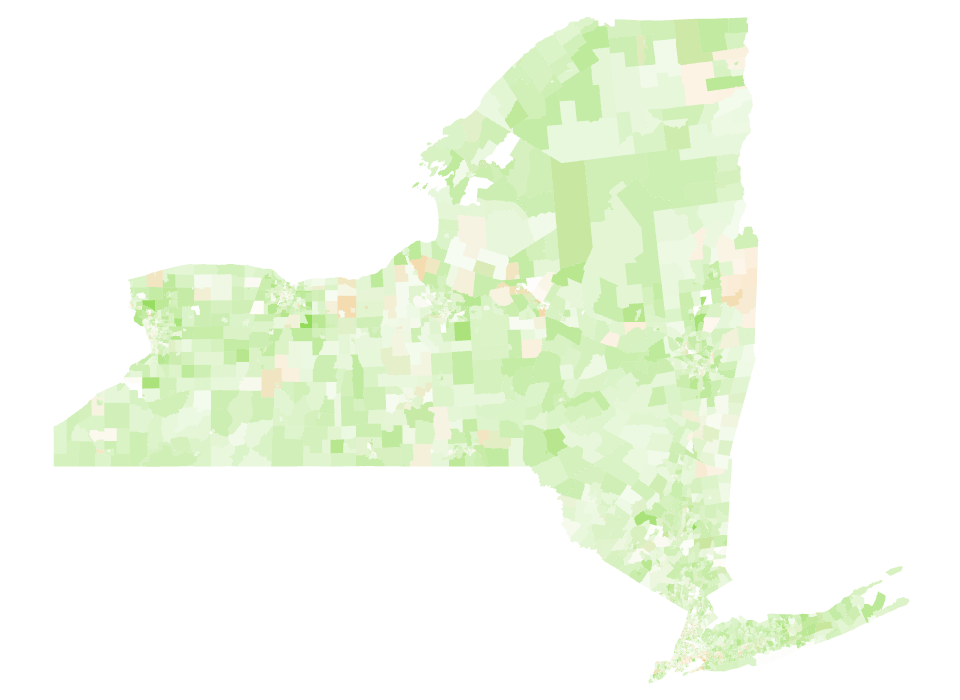
An intermediate state on the way towards trying to visualize multidimensional data for census tracts. The more green it is, the more white people there are. The more orange it is, the more black people there are.
Data from bl.ocks.org: New York Census Tracts by Mike Bostock.
Fetching of American Community Survey data inspired by Observable: Racial distribution in NC by Mark McClure.
The variables used are documented in the ACS API Reference.
MIT Licensed