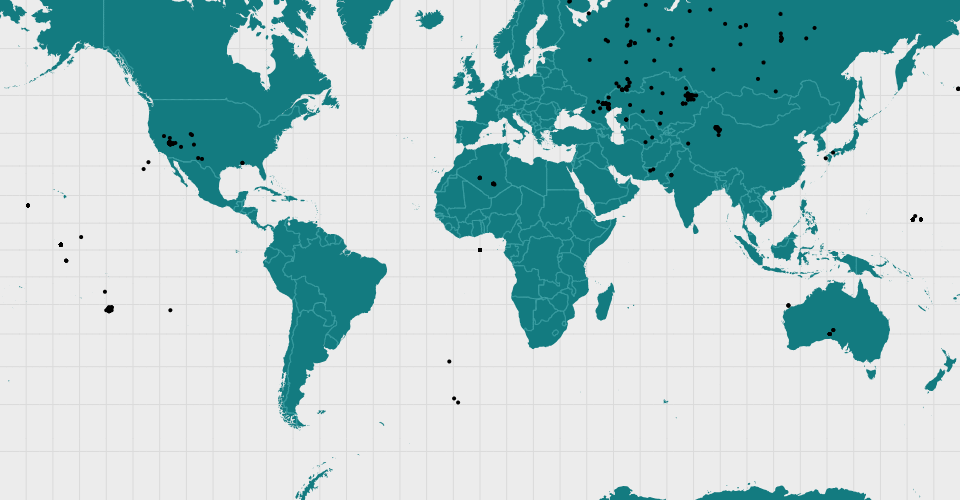
This is a visualization of the dataset Nuclear Explosions that shows where each deployments went off by latitute and longitude. The world map behind the points is a Mercator type map using the World Atlas TopoJSON. The points are off by a small fraction (down and to the left) however it fits much better on the Mercator projection over the Natural Earth projection. When the user hovers over each point, they can see the latitude and logitude of that deployment.
MIT Licensed