3D Iris Dataset Visualization
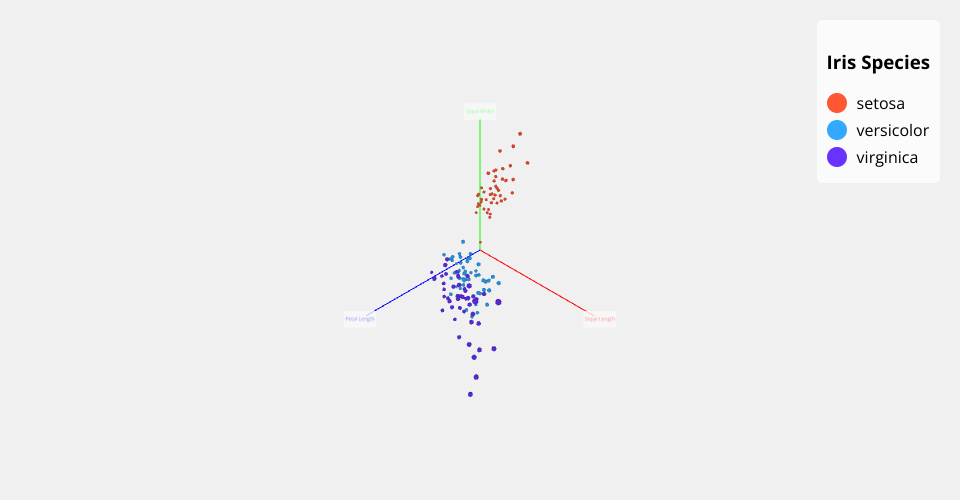
This project shows a 3D visualization of the famous Iris dataset as a scatter plot.
Features
- 3D scatter plot of the Iris dataset
- Points colored by species (setosa, versicolor, virginica)
- Interactive camera controls (rotate, zoom, pan)
- Axes with labels
- Legend for species identification
Technologies Used
- Three.js for 3D rendering
- D3.js for data loading and processing
- JavaScript ES modules
- HTML5 and CSS
MIT Licensed