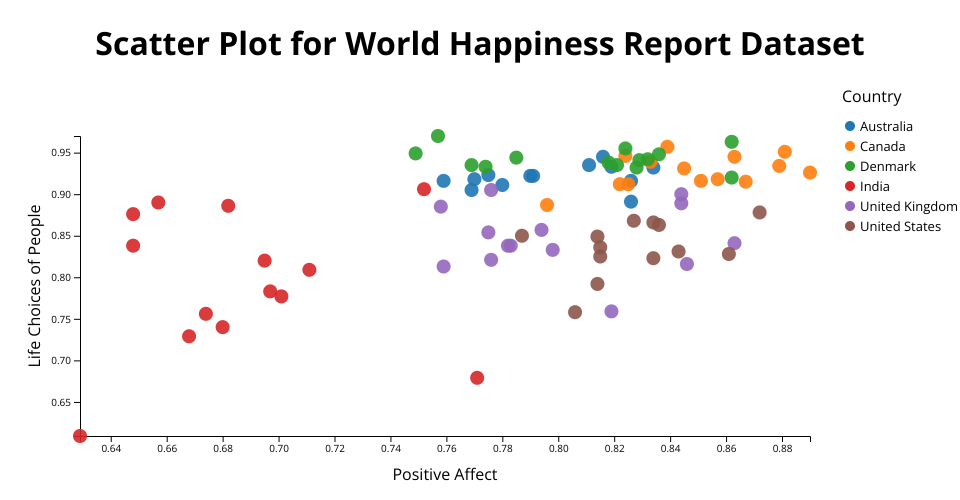
A scatter plot of the world happiness report Dataset with a color legend.
See also:
- selection.join
- d3-scale-chromatic
- ColorBrewer In colorLegend.js file we are writing code for Legend and giving colors, alignment, radius, padding, margin In axes.js file we are writing code for X and Y axis their sizes, direction, alginment, font, margins
MIT Licensed