Dataset
.
The Dataset used for the visualiztion is Ramen Ratings dataset.
.
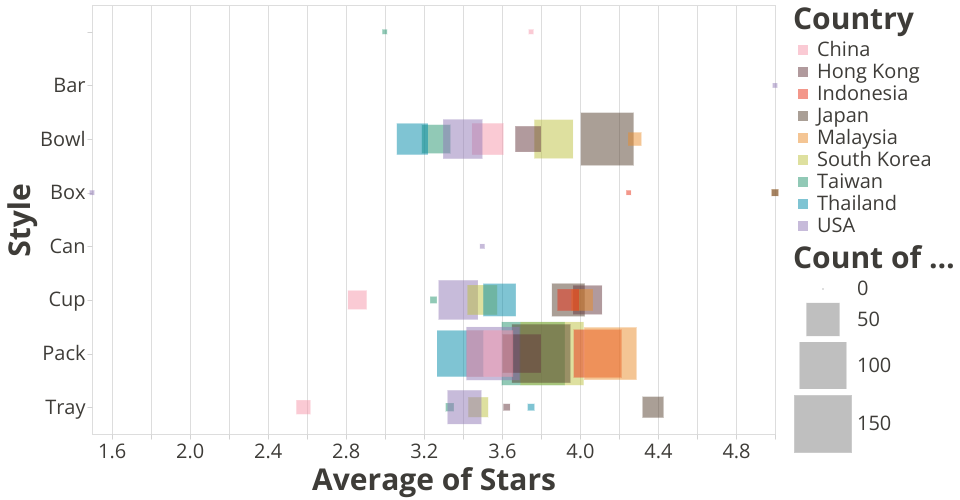
Visualization
The X axis is the average of stars in that country. The Y axis is the categorical variables Style. The size of squares indicate the counting number of Ramen reviews in that country.
.
Information Capture
Audience can capture many information from the graphs.
1.which country has the most number of ramen reviews
2.which country has the highest average of stars?
3. What style of Ramen has the highest stars?
.
A visualization constructed using the vega-lite-api.
MIT Licensed