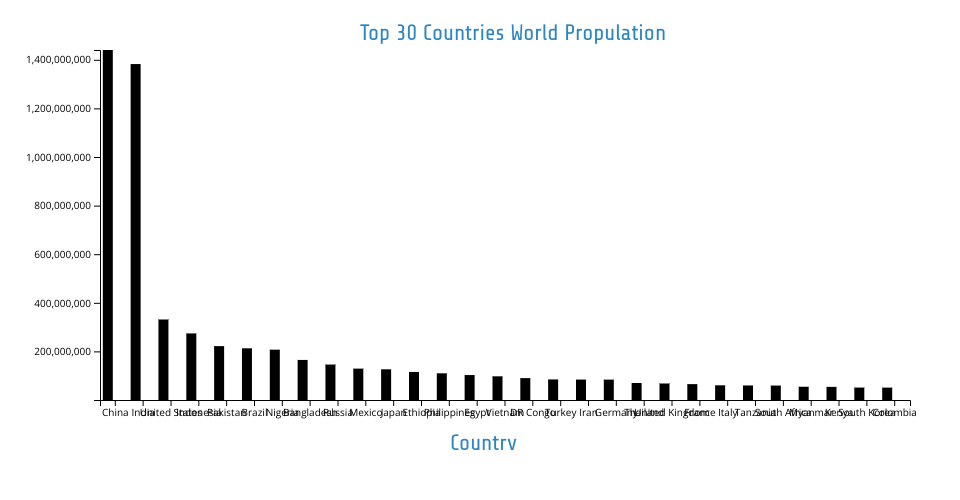
This bar chart shows population of the top 30 countries. The data comes from the year 2020 Kaggle: World Population Prospects 2020.
The Data is twisked by excel and import to JS file as CSV file. a bar chart of 30 countries was created based on population data and animated when hover with D3 and CSS
MIT Licensed