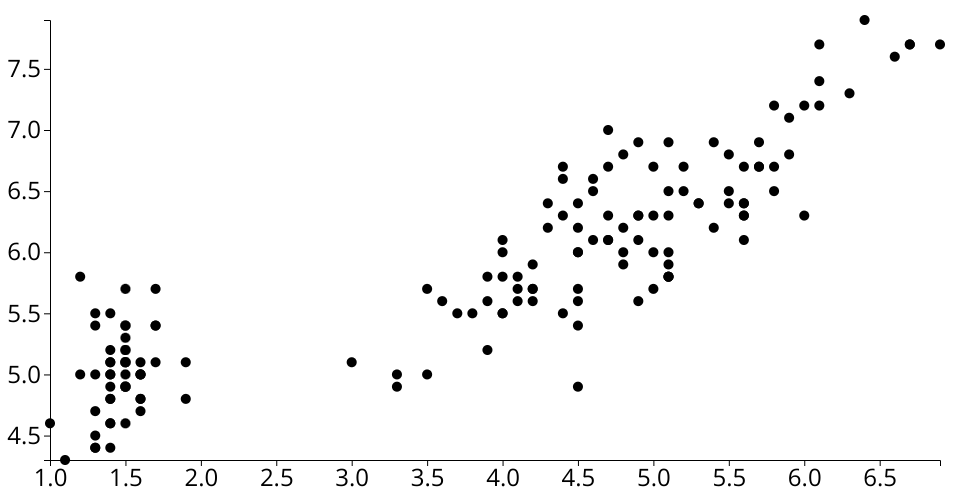
Example scatterplot
Using unpkg as cdn
goto https://unpkg.com/<package> to find the url of the latest version of the package to use in cdn
Setup
The example uses the iris dataset more information can be found here
dataset data can be used from https://gist.githubusercontent.com/curran/a08a1080b88344b0c8a7/raw/0e7a9b0a5d22642a06d3d5b9bcbad9890c8ee534/iris.csv
Howto set margins margin convention
explicit set x to start at zero then change
  const x = scaleLinear()
          .domain(extent(data, xValue))
          .range([
            margin.left,
            width - margin.right,
          ]);
to
  const x = scaleLinear()
          .domain([0, d3.max(data, xValue)])
          .range([
            margin.left,
            width - margin.right,
          ]);
modify text size of ticks by adding a css styling
      .tick text {
        font-size: 24px;
      }
.tick points to the d3 ticks, space text refers to all text elements but only in the context of ticks
References
Preparing data for visualisation Datasets from curran Tot 11:33
MIT Licensed