A visualization constructed using the vega-lite-api.
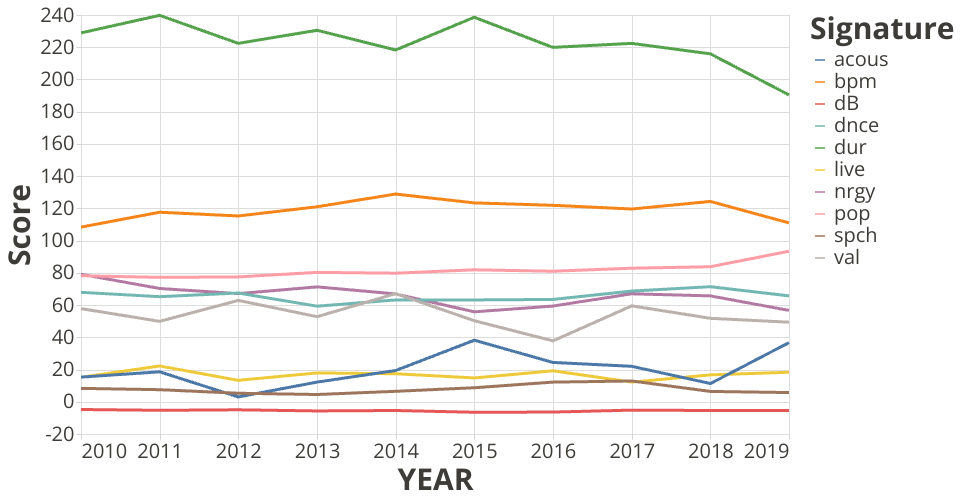
The graph shows the trend of music component signature since 2010 to 2019. Data were preprocessed by Rstudio, taking the average data of top 10 Spotify playing music every year. Standard deviation is calculated to show the variant of each category.
Till now it's still difficult to use vega lite api to reshape the data to the nice form that we want, thus I chose to use other tools to preprocess.
See Data on Gist: Yearly Music Trend
The original data comes from the Observable
MIT Licensed