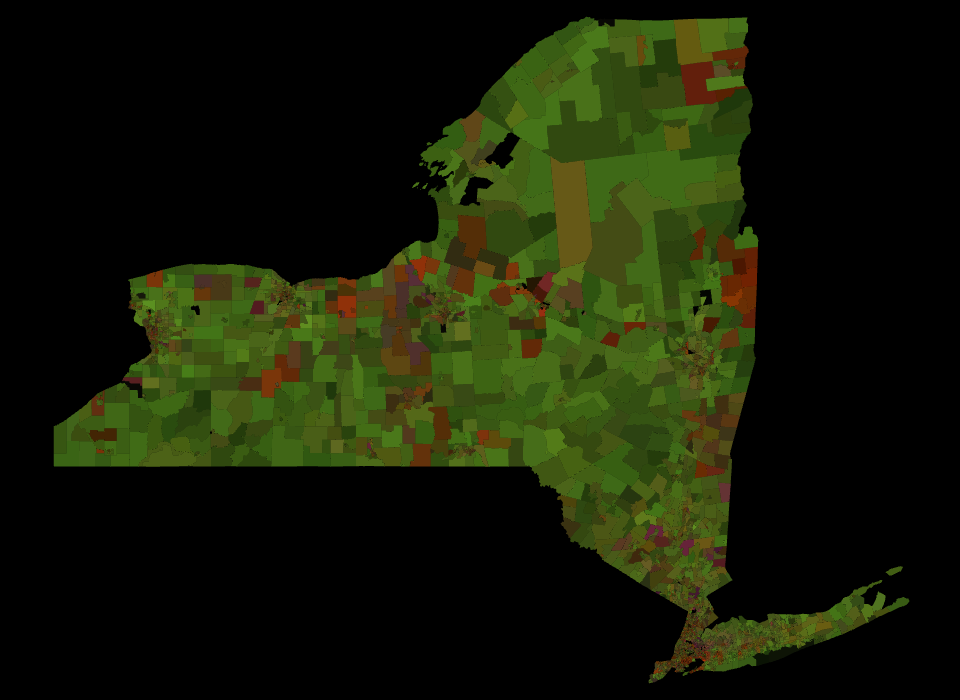
An intermediate state on the way towards trying to visualize multidimensional data for census tracts. The more green it is, the more white people there are.
This uses a linear scale that varies in opacity only.
Data from bl.ocks.org: New York Census Tracts by Mike Bostock.
Fetching of American Community Survey data inspired by Observable: Racial distribution in NC by Mark McClure.
The variables used are documented in the ACS API Reference.
MIT Licensed