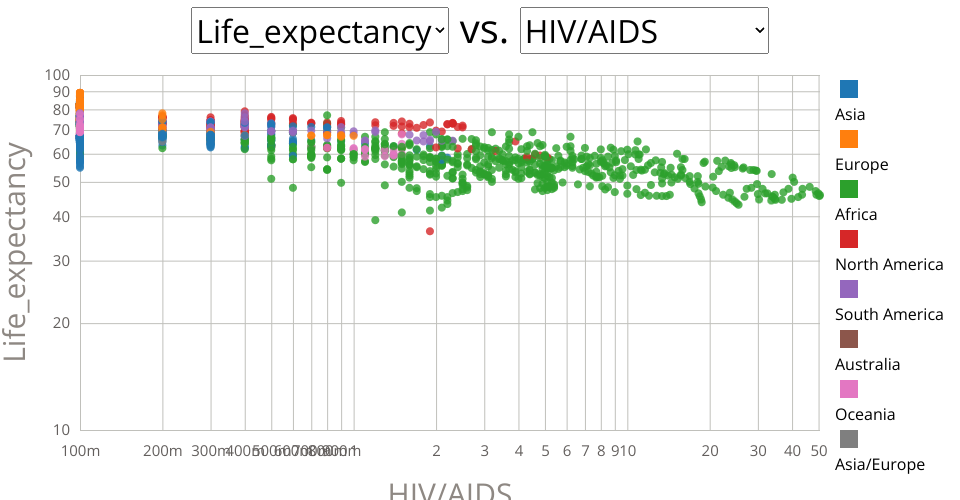
An interactive color legend scatter plot with Dropdown Menu for Life Expectancy Data with informative Tooltips.
This scatterplot takes required inputs from the data(like HIV/AIDS, GDP, BMI,Adult Mortality, Year, Life Expectancy and Continent) and uses these as inputs to both X and Y axes with the help of a dropdown. This scatter plot would help in finding the correlation between these various inputs using Continent as the color legend. Clicking on th color legend would display the data relevant to that continent. Hovering over the data would display all necessary information to summarize the visualized data in the form of Continent,Year, and the X and Y Axes values.
MIT Licensed