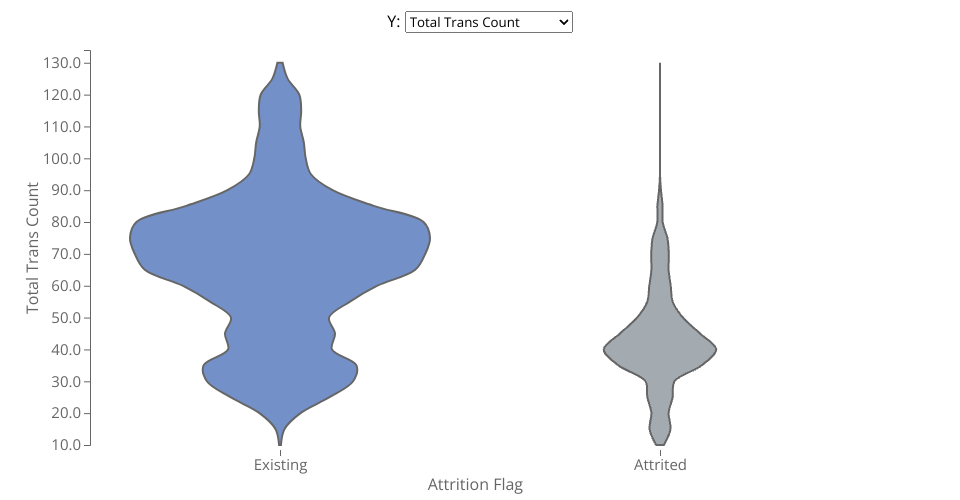
Violin plots using D3 displaying data of attrition level by different quantitative variables from the Bank Customers Dataset.
The menu at the top enable the users to choose which quantitative columns to use. The options are:
- Customer age
- Credit limit
- Total revolving balance
- Total transaction amount
- Total transaction count
- Avg. utilization ratio
Finally, the attrition status of the customers is encoded on the color of the violins, the users can highlight the violins by hovering over them and see the values used to construct them on the tooltip.
MIT Licensed