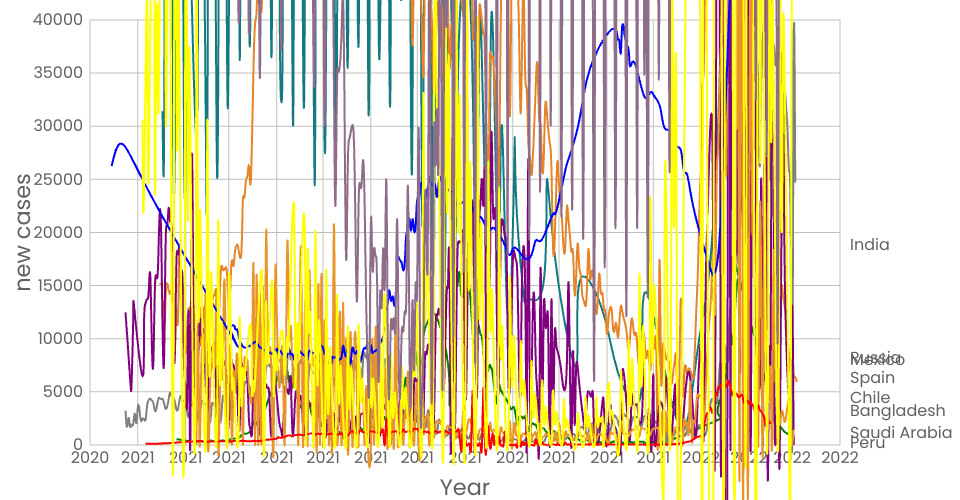
This visualization helps to see country wise line graph of new covid cases data with focus on hover over country name Covid Data is taken from The Covid Dataset File.
MIT Licensed
This visualization helps to see country wise line graph of new covid cases data with focus on hover over country name Covid Data is taken from The Covid Dataset File.