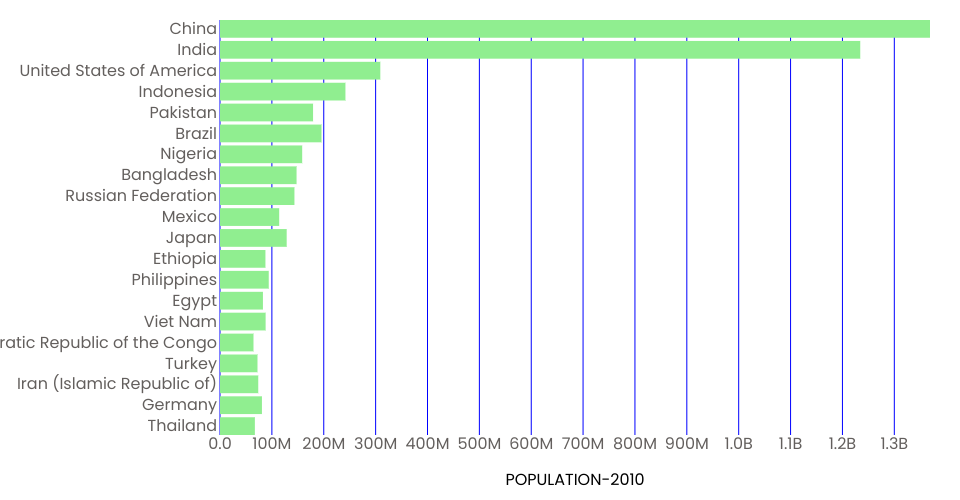
. I have listed the 20 countries from the year 2010 in bar chart where the countries are visualized on the y – axis and the population – 2010 is seen on the x – axis.
MIT Licensed
. I have listed the 20 countries from the year 2010 in bar chart where the countries are visualized on the y – axis and the population – 2010 is seen on the x – axis.