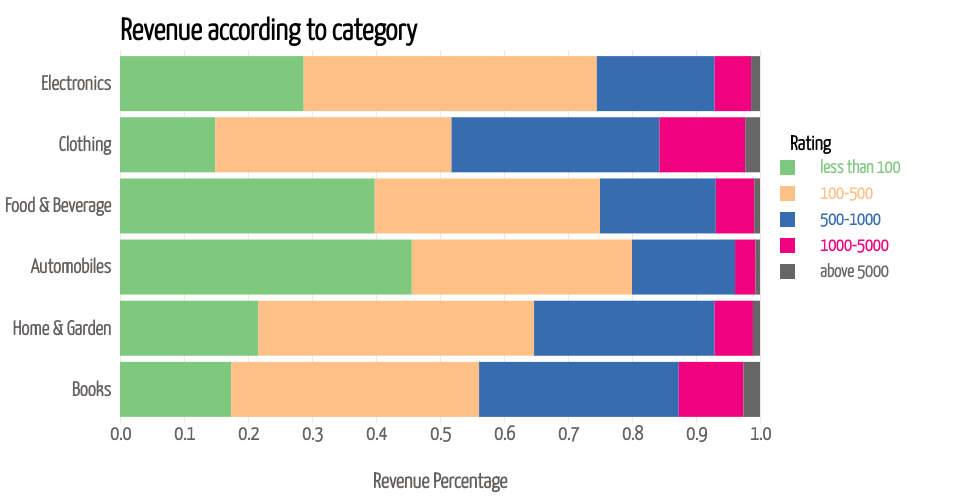
The impact of revenue of different categories
This stacked bar chart gives the percentage of each revenue of different categories. The aim is to show the revenue of different categories in a stacked bar visual. When the mouse hovers over each bar, you can see pop-ups of accurate percentage of each revenue percentage of different categories. Total percentage is 1, representing 100%.
MIT Licensed