Deforestation Visualization
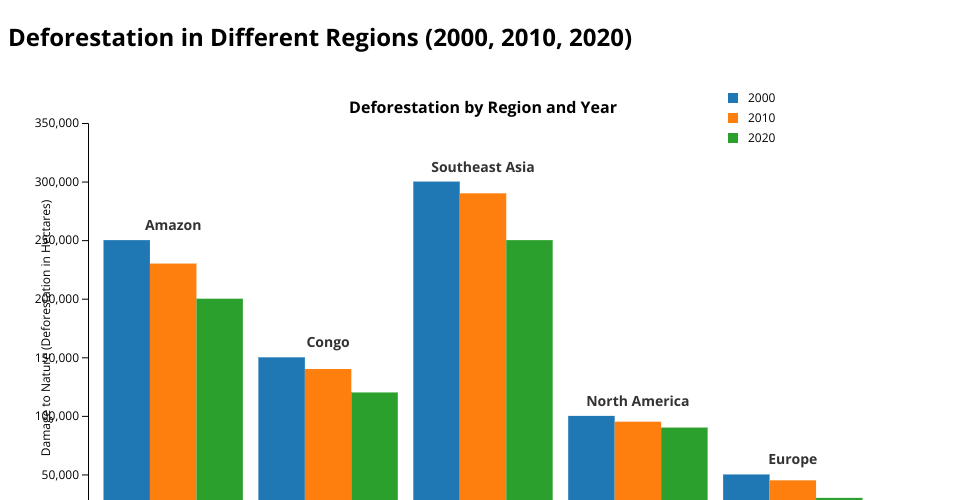
This project visualizes deforestation data from 2000 to 2020 using a stacked bar chart.
Data
The data is stored in data.csv and includes deforestation
metrics for different regions.
How to Run
- Open the
index.htmlfile in a web browser. - You will see a stacked bar chart showing deforestation from 2000 to 2020.
Technologies Used
- D3.js for data visualization
MIT Licensed