// README.md
D3 Iris Scatter Plot
Setup and Run
- Install dependencies:
npm install - Start the server:
npm start - Open
http://localhost:3000in a browser.
Description
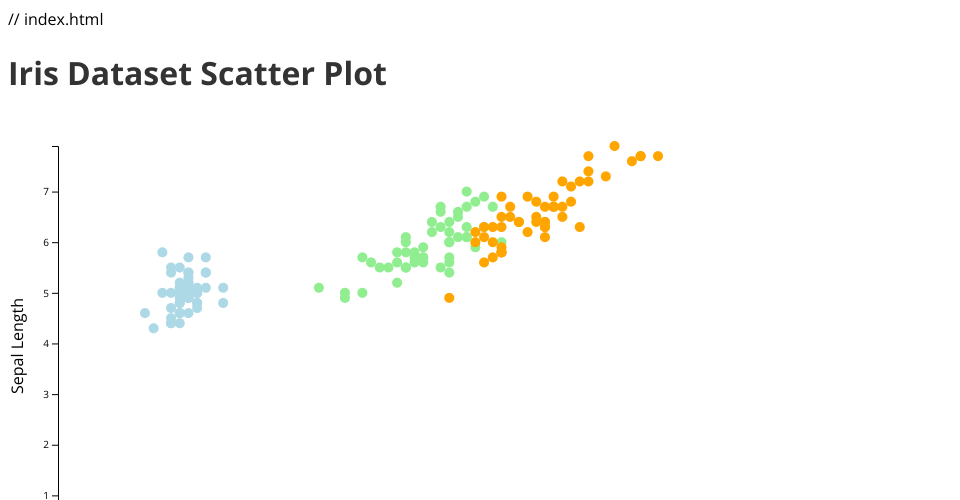
This project visualizes the Iris dataset using a D3 scatter plot. The plot colors each species differently:
- Setosa: Light blue
- Versicolor: Light green
- Virginica: Orange
MIT Licensed