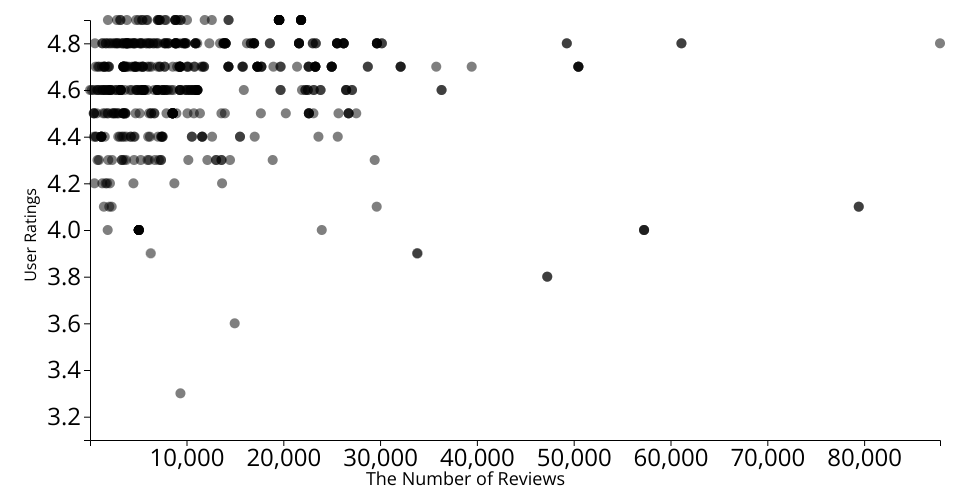
This is a scatter plot about how the books total review numbers corelated to it's average user rating. The original dataset comes from Kaggle Dataset: Amazon Top 50 Bestselling Books 2009 - 2019
This visualization shows A Github Gist: Amazon Top 50 Bestselling Books
The XAxis represents The total number of reviews of the book. The YAxis represents the average ratings of the book.
MIT Licensed