Data
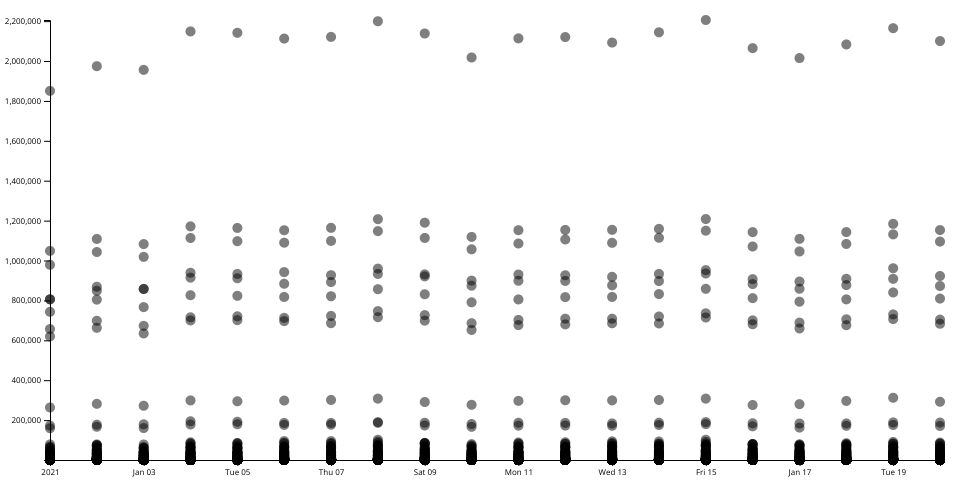
This scatter plot describes the within-state estimated mobility wich is extacted from MA cell move data during 2021-01-01 to 2021-01-20 (the peak of covid cases in Massachusetts) in MA.
Description
x-axis represents time from Jan 1st, 2021 to Jan 20, 2021. y-axis represents estimated population flow. As the time passed, the mobility increases.
MIT Licensed