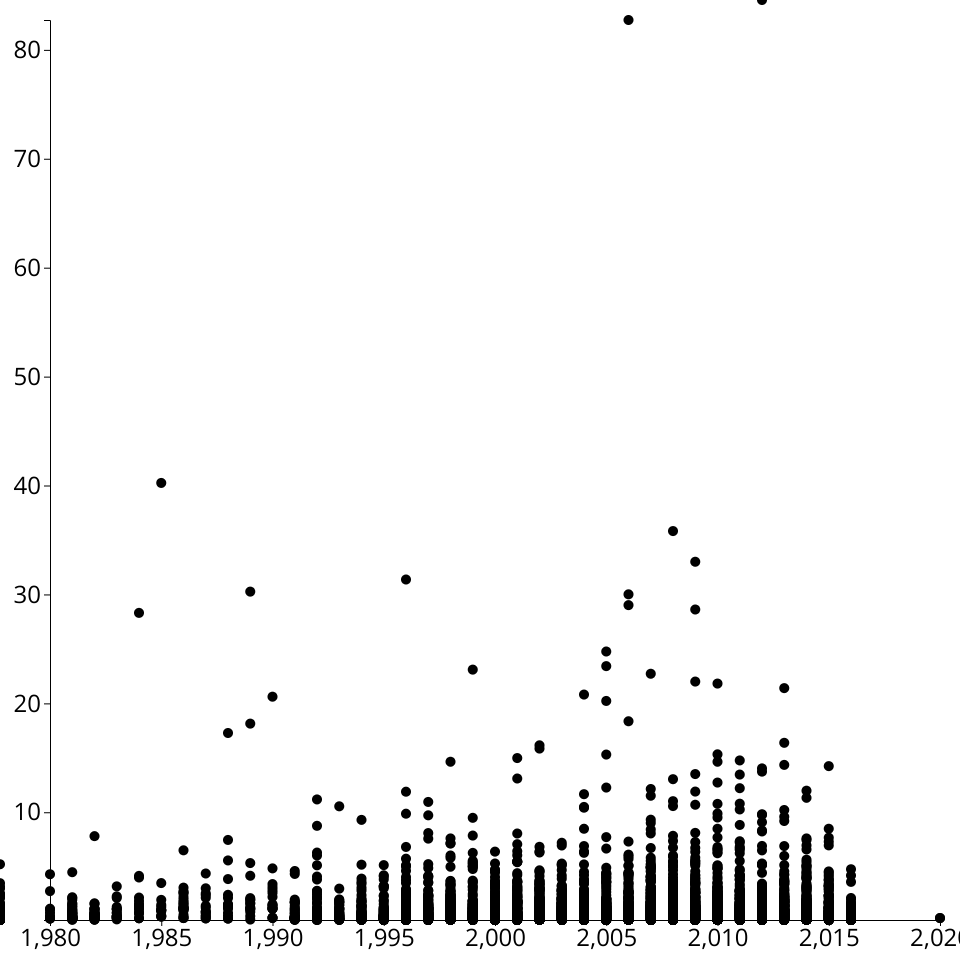
A vanilla HTML implementation of a D3 scatter plot. Shows the (https://gist.github.com/Rochelle-Wu/6cb1e6fd26fc9980374dac3a98bdc435).
The X-axis is year
The Y-axis is the data of global sales
The data comes from https://www.kaggle.com/gregorut/videogamesales
MIT Licensed