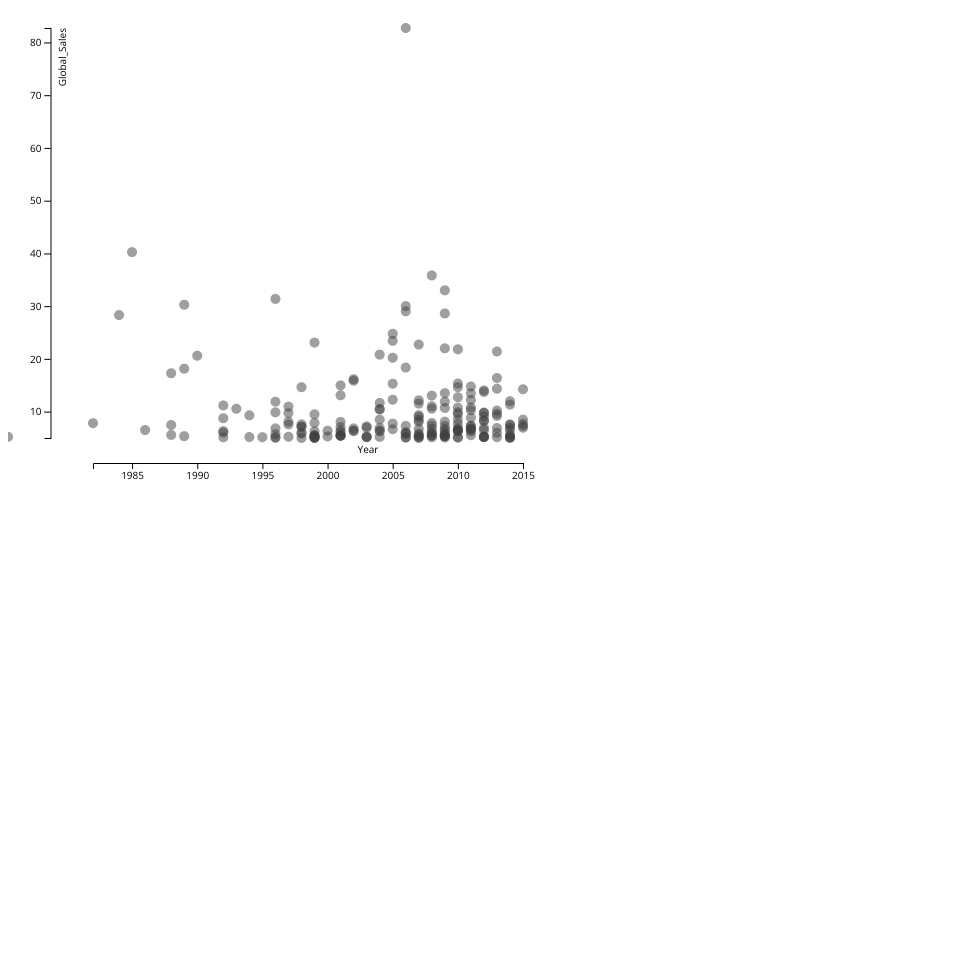
A vanilla HTML implementation of a D3 scatter plot. Shows the (https://gist.github.com/Rochelle-Wu/4e7515233d56de364f848f91ae25101d).
The X-axis is year
The Y-axis is the data of global sales
Thanks for Sitanshu Rupani's work, which bring me inspiration
The data comes from https://www.kaggle.com/gregorut/videogamesales
MIT Licensed