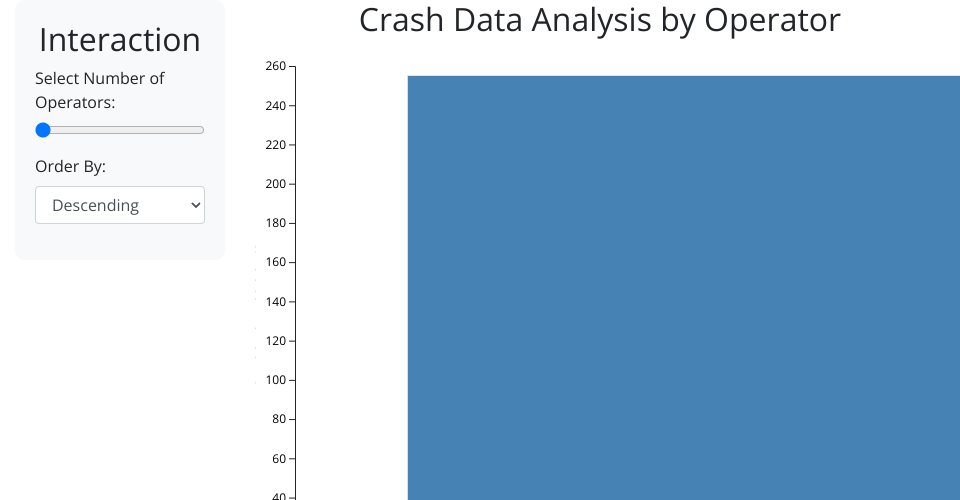
This is a D3.js interactive graph that shows the number of crashes by operator where the y-axis shows the number of crashes while the x-axis shows different operators.
MIT Licensed
This is a D3.js interactive graph that shows the number of crashes by operator where the y-axis shows the number of crashes while the x-axis shows different operators.