Interactive bar chart example
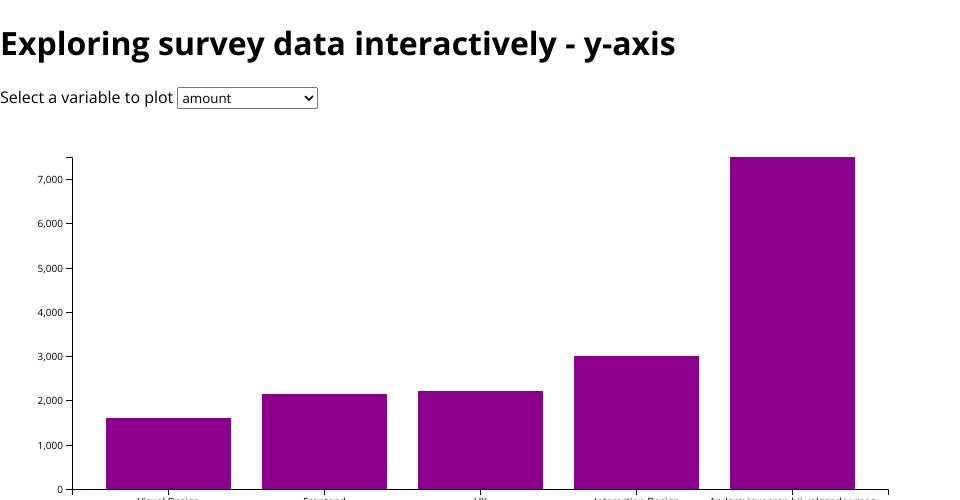
In this visualization, the data that's rendered in the view changes because of user interaction
Differences from forked work
- This uses d3V6 which means .nest() had to be replaced with .rollup() using the d3 migration guide
Steps
- Find good example of update loop
- Write a concept that uses interaction (changing scales?)
- Set up basic chart
- Set up interacion
- Make x-axis interactive so remove and enter are also needed
Concept
A chart showing distribution or relation between to variables. The vriables can be chosen through a dropdown menu resulting in a rerendering of datapoints and axis.
- Group students by subject interest on x axis.
- Get data from different vars on y axis
Notes
- Note that d3 has a new way of handling enter, update and exit explicitly as explained in this article.
- The options in the form are generated from the data using a data join
- The scales, the data and the selected opton are global. I found that to be nicer than to keep passing them everywhere
- If you want to add a new option to this interactive graph, all you have to do is add a new computed variable in the prepareData module and everything else will happen automatic
Inspiration
MIT Licensed