Enhanced Line Chart
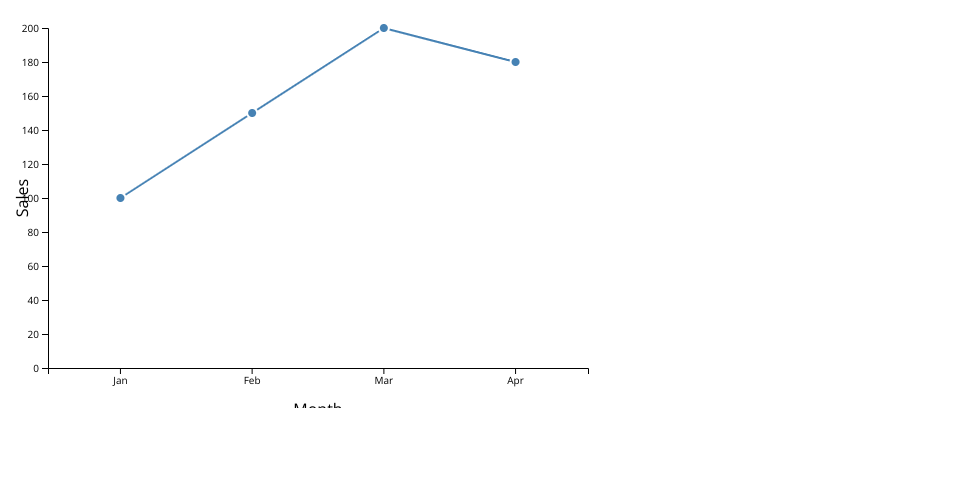
This HTML file utilizes D3.js library to create an interactive line chart displaying sales data for a product category over time. Each data point is represented by a circle, with tooltips showing the corresponding month and sales value. Axes are labeled for clarity, with the x-axis indicating months and the y-axis indicating sales volume.
MIT Licensed