Enhanced Area Chart
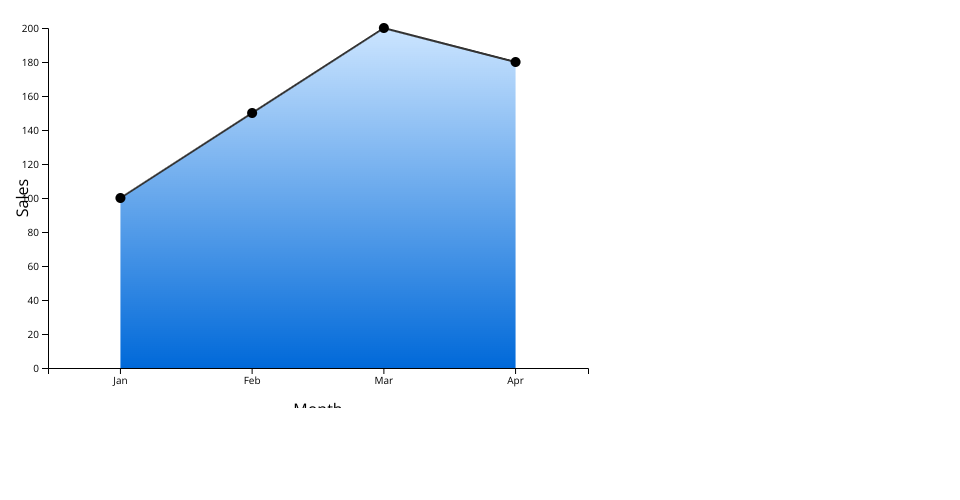
This HTML file creates an interactive area chart using D3.js library to visualize sales data for a product category over time. The area under the curve is filled with a gradient color, and each data point is represented by a circle. Tooltips display the corresponding month and sales value upon hover. Axes are labeled for clarity, with the x-axis indicating months and the y-axis indicating sales volume.
MIT Licensed